40.8 Visualizations & Plots
Customize plots to match target journal aesthetics. Below we provide an American Marketing Association–ready theme and examples. (Change fonts on your system as needed.)
# AMA-inspired theme (serif base, clean grid)
amatheme <- theme_bw(base_size = 14, base_family = "serif") +
  theme(
    panel.grid.major   = element_blank(),
    panel.grid.minor   = element_blank(),
    panel.border       = element_blank(),
    line               = element_line(),
    text               = element_text(),
    legend.title       = element_text(size = rel(0.6), face = "bold"),
    legend.text        = element_text(size = rel(0.6)),
    legend.background  = element_rect(color = "black"),
    plot.title         = element_text(
      size   = rel(1.2),
      face   = "bold",
      hjust  = 0.5,
      margin = margin(b = 15)
    ),
    plot.margin        = unit(c(1, 1, 1, 1), "cm"),
    axis.line          = element_line(colour = "black", linewidth = .8),
    axis.ticks         = element_line(),
    axis.title.x       = element_text(size = rel(1.2), face = "bold"),
    axis.title.y       = element_text(size = rel(1.2), face = "bold"),
    axis.text.y        = element_text(size = rel(1)),
    axis.text.x        = element_text(size = rel(1))
  )
# Example plot
library(tidyverse)
library(ggsci)
data("mtcars")
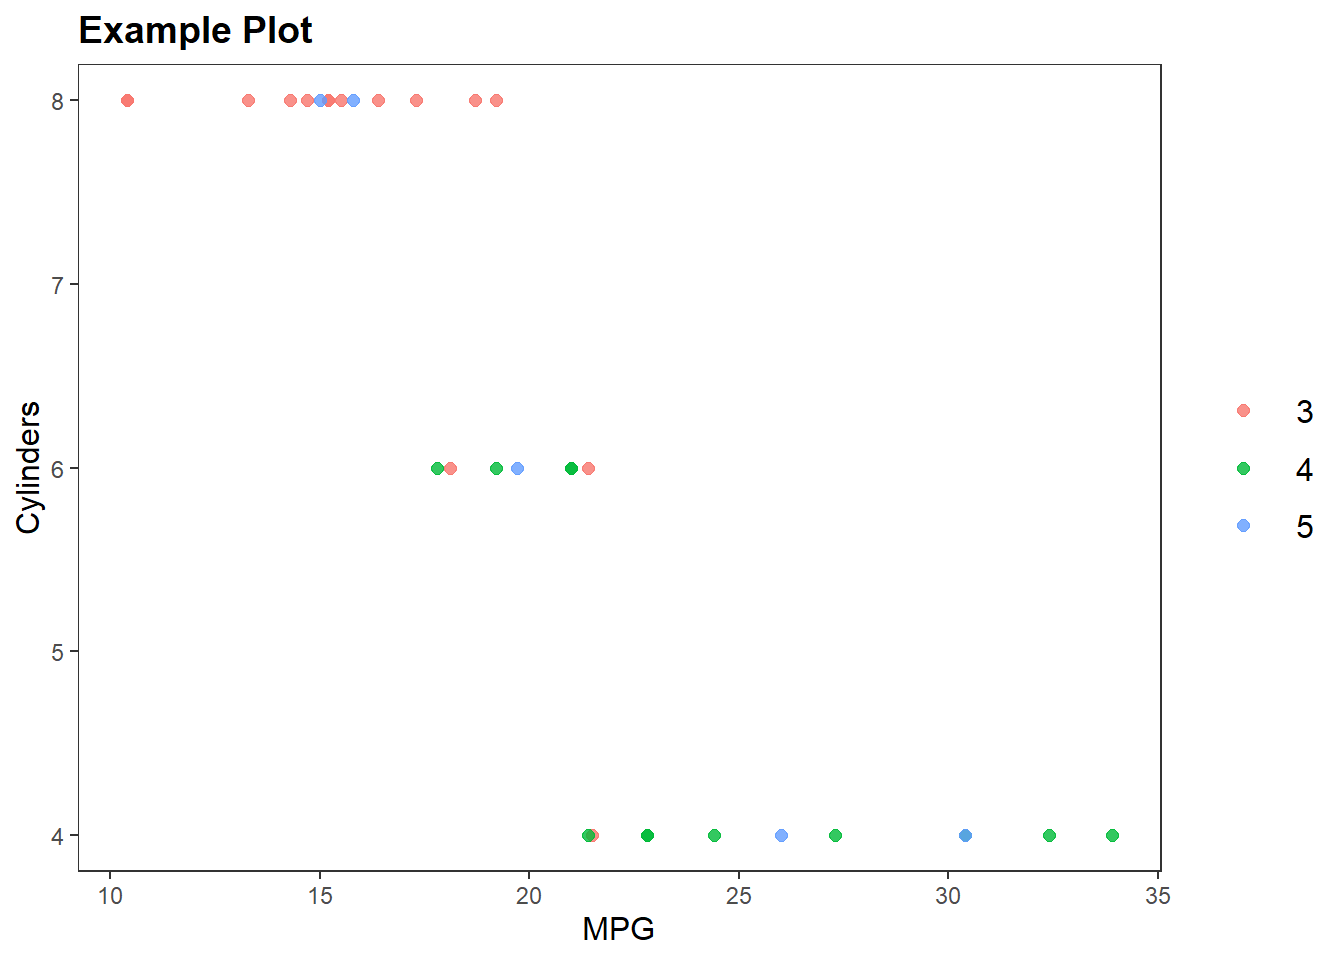
yourplot <- mtcars %>%
select(mpg, cyl, gear) %>%
ggplot(aes(x = mpg, y = cyl, color = factor(gear))) +
geom_point(size = 2, alpha = .8) +
labs(title = "Example Plot", x = "MPG", y = "Cylinders", color = "Gears")
yourplot + amatheme + scale_color_npg()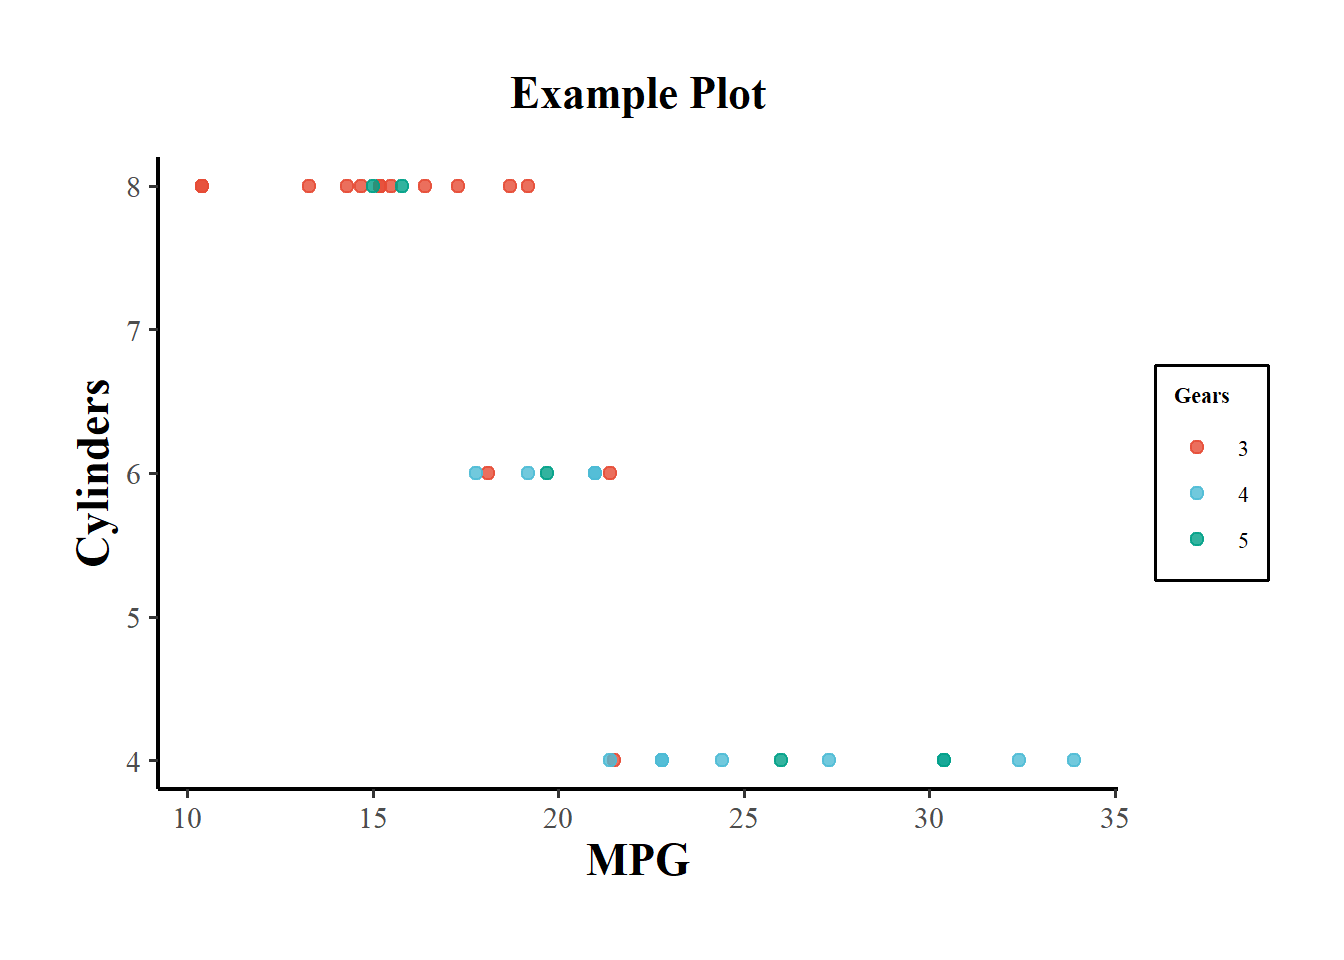
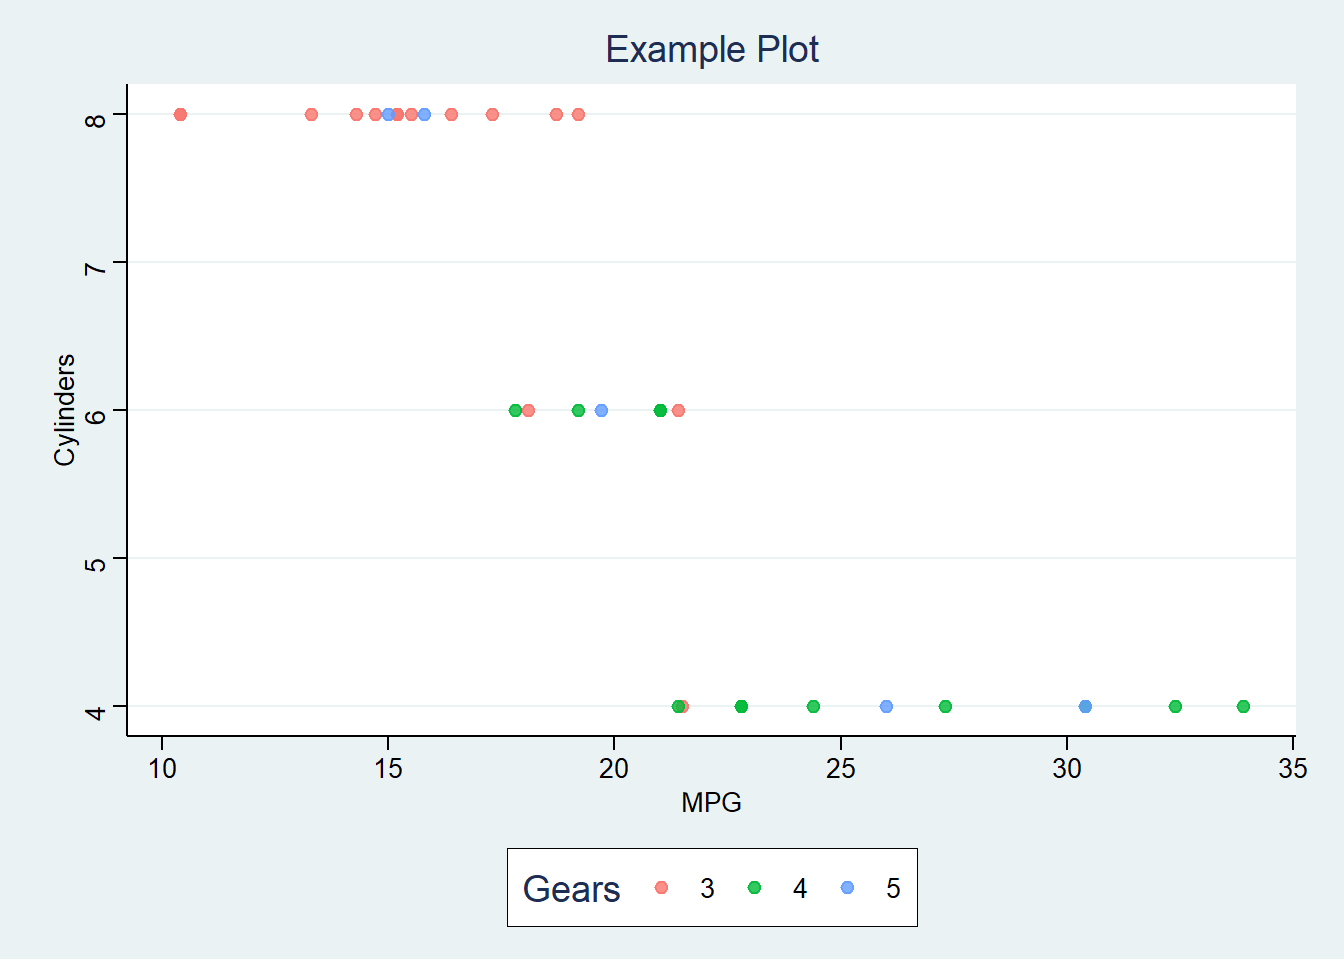


# APA-like theme from jtools
jtools::theme_apa(
  legend.font.size = 12,
  x.font.size = 12,
  y.font.size = 12
)
#> <theme> List of 144
#>  $ line                            : <ggplot2::element_line>
#>   ..@ colour       : chr "black"
#>   ..@ linewidth    : num 0.5
#>   ..@ linetype     : num 1
#>   ..@ lineend      : chr "butt"
#>   ..@ linejoin     : chr "round"
#>   ..@ arrow        : logi FALSE
#>   ..@ arrow.fill   : chr "black"
#>   ..@ inherit.blank: logi TRUE
#>  $ rect                            : <ggplot2::element_rect>
#>   ..@ fill         : chr "white"
#>   ..@ colour       : chr "black"
#>   ..@ linewidth    : num 0.5
#>   ..@ linetype     : num 1
#>   ..@ linejoin     : chr "round"
#>   ..@ inherit.blank: logi TRUE
#>  $ text                            : <ggplot2::element_text>
#>   ..@ family       : chr ""
#>   ..@ face         : chr "plain"
#>   ..@ italic       : chr NA
#>   ..@ fontweight   : num NA
#>   ..@ fontwidth    : num NA
#>   ..@ colour       : chr "black"
#>   ..@ size         : num 11
#>   ..@ hjust        : num 0.5
#>   ..@ vjust        : num 0.5
#>   ..@ angle        : num 0
#>   ..@ lineheight   : num 0.9
#>   ..@ margin       : <ggplot2::margin> num [1:4] 0 0 0 0
#>   ..@ debug        : logi FALSE
#>   ..@ inherit.blank: logi TRUE
#>  $ title                           : <ggplot2::element_text>
#>   ..@ family       : NULL
#>   ..@ face         : NULL
#>   ..@ italic       : chr NA
#>   ..@ fontweight   : num NA
#>   ..@ fontwidth    : num NA
#>   ..@ colour       : NULL
#>   ..@ size         : NULL
#>   ..@ hjust        : NULL
#>   ..@ vjust        : NULL
#>   ..@ angle        : NULL
#>   ..@ lineheight   : NULL
#>   ..@ margin       : NULL
#>   ..@ debug        : NULL
#>   ..@ inherit.blank: logi TRUE
#>  $ point                           : <ggplot2::element_point>
#>   ..@ colour       : chr "black"
#>   ..@ shape        : num 19
#>   ..@ size         : num 1.5
#>   ..@ fill         : chr "white"
#>   ..@ stroke       : num 0.5
#>   ..@ inherit.blank: logi TRUE
#>  $ polygon                         : <ggplot2::element_polygon>
#>   ..@ fill         : chr "white"
#>   ..@ colour       : chr "black"
#>   ..@ linewidth    : num 0.5
#>   ..@ linetype     : num 1
#>   ..@ linejoin     : chr "round"
#>   ..@ inherit.blank: logi TRUE
#>  $ geom                            : <ggplot2::element_geom>
#>   ..@ ink        : chr "black"
#>   ..@ paper      : chr "white"
#>   ..@ accent     : chr "#3366FF"
#>   ..@ linewidth  : num 0.5
#>   ..@ borderwidth: num 0.5
#>   ..@ linetype   : int 1
#>   ..@ bordertype : int 1
#>   ..@ family     : chr ""
#>   ..@ fontsize   : num 3.87
#>   ..@ pointsize  : num 1.5
#>   ..@ pointshape : num 19
#>   ..@ colour     : NULL
#>   ..@ fill       : NULL
#>  $ spacing                         : 'simpleUnit' num 5.5points
#>   ..- attr(*, "unit")= int 8
#>  $ margins                         : <ggplot2::margin> num [1:4] 5.5 5.5 5.5 5.5
#>  $ aspect.ratio                    : NULL
#>  $ axis.title                      : NULL
#>  $ axis.title.x                    : <ggplot2::element_text>
#>   ..@ family       : NULL
#>   ..@ face         : NULL
#>   ..@ italic       : chr NA
#>   ..@ fontweight   : num NA
#>   ..@ fontwidth    : num NA
#>   ..@ colour       : NULL
#>   ..@ size         : num 12
#>   ..@ hjust        : NULL
#>   ..@ vjust        : num 1
#>   ..@ angle        : NULL
#>   ..@ lineheight   : NULL
#>   ..@ margin       : <ggplot2::margin> num [1:4] 2.75 0 0 0
#>   ..@ debug        : NULL
#>   ..@ inherit.blank: logi FALSE
#>  $ axis.title.x.top                : <ggplot2::element_text>
#>   ..@ family       : NULL
#>   ..@ face         : NULL
#>   ..@ italic       : chr NA
#>   ..@ fontweight   : num NA
#>   ..@ fontwidth    : num NA
#>   ..@ colour       : NULL
#>   ..@ size         : NULL
#>   ..@ hjust        : NULL
#>   ..@ vjust        : num 0
#>   ..@ angle        : NULL
#>   ..@ lineheight   : NULL
#>   ..@ margin       : <ggplot2::margin> num [1:4] 0 0 2.75 0
#>   ..@ debug        : NULL
#>   ..@ inherit.blank: logi TRUE
#>  $ axis.title.x.bottom             : NULL
#>  $ axis.title.y                    : <ggplot2::element_text>
#>   ..@ family       : NULL
#>   ..@ face         : NULL
#>   ..@ italic       : chr NA
#>   ..@ fontweight   : num NA
#>   ..@ fontwidth    : num NA
#>   ..@ colour       : NULL
#>   ..@ size         : num 12
#>   ..@ hjust        : NULL
#>   ..@ vjust        : num 1
#>   ..@ angle        : num 90
#>   ..@ lineheight   : NULL
#>   ..@ margin       : <ggplot2::margin> num [1:4] 0 2.75 0 0
#>   ..@ debug        : NULL
#>   ..@ inherit.blank: logi FALSE
#>  $ axis.title.y.left               : NULL
#>  $ axis.title.y.right              : <ggplot2::element_text>
#>   ..@ family       : NULL
#>   ..@ face         : NULL
#>   ..@ italic       : chr NA
#>   ..@ fontweight   : num NA
#>   ..@ fontwidth    : num NA
#>   ..@ colour       : NULL
#>   ..@ size         : NULL
#>   ..@ hjust        : NULL
#>   ..@ vjust        : num 1
#>   ..@ angle        : num -90
#>   ..@ lineheight   : NULL
#>   ..@ margin       : <ggplot2::margin> num [1:4] 0 0 0 2.75
#>   ..@ debug        : NULL
#>   ..@ inherit.blank: logi TRUE
#>  $ axis.text                       : <ggplot2::element_text>
#>   ..@ family       : NULL
#>   ..@ face         : NULL
#>   ..@ italic       : chr NA
#>   ..@ fontweight   : num NA
#>   ..@ fontwidth    : num NA
#>   ..@ colour       : chr "#4D4D4DFF"
#>   ..@ size         : 'rel' num 0.8
#>   ..@ hjust        : NULL
#>   ..@ vjust        : NULL
#>   ..@ angle        : NULL
#>   ..@ lineheight   : NULL
#>   ..@ margin       : NULL
#>   ..@ debug        : NULL
#>   ..@ inherit.blank: logi TRUE
#>  $ axis.text.x                     : <ggplot2::element_text>
#>   ..@ family       : NULL
#>   ..@ face         : NULL
#>   ..@ italic       : chr NA
#>   ..@ fontweight   : num NA
#>   ..@ fontwidth    : num NA
#>   ..@ colour       : NULL
#>   ..@ size         : NULL
#>   ..@ hjust        : NULL
#>   ..@ vjust        : num 1
#>   ..@ angle        : NULL
#>   ..@ lineheight   : NULL
#>   ..@ margin       : <ggplot2::margin> num [1:4] 2.2 0 0 0
#>   ..@ debug        : NULL
#>   ..@ inherit.blank: logi TRUE
#>  $ axis.text.x.top                 : <ggplot2::element_text>
#>   ..@ family       : NULL
#>   ..@ face         : NULL
#>   ..@ italic       : chr NA
#>   ..@ fontweight   : num NA
#>   ..@ fontwidth    : num NA
#>   ..@ colour       : NULL
#>   ..@ size         : NULL
#>   ..@ hjust        : NULL
#>   ..@ vjust        : num 0
#>   ..@ angle        : NULL
#>   ..@ lineheight   : NULL
#>   ..@ margin       : <ggplot2::margin> num [1:4] 0 0 2.2 0
#>   ..@ debug        : NULL
#>   ..@ inherit.blank: logi TRUE
#>  $ axis.text.x.bottom              : NULL
#>  $ axis.text.y                     : <ggplot2::element_text>
#>   ..@ family       : NULL
#>   ..@ face         : NULL
#>   ..@ italic       : chr NA
#>   ..@ fontweight   : num NA
#>   ..@ fontwidth    : num NA
#>   ..@ colour       : NULL
#>   ..@ size         : NULL
#>   ..@ hjust        : num 1
#>   ..@ vjust        : NULL
#>   ..@ angle        : NULL
#>   ..@ lineheight   : NULL
#>   ..@ margin       : <ggplot2::margin> num [1:4] 0 2.2 0 0
#>   ..@ debug        : NULL
#>   ..@ inherit.blank: logi TRUE
#>  $ axis.text.y.left                : NULL
#>  $ axis.text.y.right               : <ggplot2::element_text>
#>   ..@ family       : NULL
#>   ..@ face         : NULL
#>   ..@ italic       : chr NA
#>   ..@ fontweight   : num NA
#>   ..@ fontwidth    : num NA
#>   ..@ colour       : NULL
#>   ..@ size         : NULL
#>   ..@ hjust        : num 0
#>   ..@ vjust        : NULL
#>   ..@ angle        : NULL
#>   ..@ lineheight   : NULL
#>   ..@ margin       : <ggplot2::margin> num [1:4] 0 0 0 2.2
#>   ..@ debug        : NULL
#>   ..@ inherit.blank: logi TRUE
#>  $ axis.text.theta                 : NULL
#>  $ axis.text.r                     : <ggplot2::element_text>
#>   ..@ family       : NULL
#>   ..@ face         : NULL
#>   ..@ italic       : chr NA
#>   ..@ fontweight   : num NA
#>   ..@ fontwidth    : num NA
#>   ..@ colour       : NULL
#>   ..@ size         : NULL
#>   ..@ hjust        : num 0.5
#>   ..@ vjust        : NULL
#>   ..@ angle        : NULL
#>   ..@ lineheight   : NULL
#>   ..@ margin       : <ggplot2::margin> num [1:4] 0 2.2 0 2.2
#>   ..@ debug        : NULL
#>   ..@ inherit.blank: logi TRUE
#>  $ axis.ticks                      : <ggplot2::element_line>
#>   ..@ colour       : chr "#333333FF"
#>   ..@ linewidth    : NULL
#>   ..@ linetype     : NULL
#>   ..@ lineend      : NULL
#>   ..@ linejoin     : NULL
#>   ..@ arrow        : logi FALSE
#>   ..@ arrow.fill   : chr "#333333FF"
#>   ..@ inherit.blank: logi TRUE
#>  $ axis.ticks.x                    : NULL
#>  $ axis.ticks.x.top                : NULL
#>  $ axis.ticks.x.bottom             : NULL
#>  $ axis.ticks.y                    : NULL
#>  $ axis.ticks.y.left               : NULL
#>  $ axis.ticks.y.right              : NULL
#>  $ axis.ticks.theta                : NULL
#>  $ axis.ticks.r                    : NULL
#>  $ axis.minor.ticks.x.top          : NULL
#>  $ axis.minor.ticks.x.bottom       : NULL
#>  $ axis.minor.ticks.y.left         : NULL
#>  $ axis.minor.ticks.y.right        : NULL
#>  $ axis.minor.ticks.theta          : NULL
#>  $ axis.minor.ticks.r              : NULL
#>  $ axis.ticks.length               : 'rel' num 0.5
#>  $ axis.ticks.length.x             : NULL
#>  $ axis.ticks.length.x.top         : NULL
#>  $ axis.ticks.length.x.bottom      : NULL
#>  $ axis.ticks.length.y             : NULL
#>  $ axis.ticks.length.y.left        : NULL
#>  $ axis.ticks.length.y.right       : NULL
#>  $ axis.ticks.length.theta         : NULL
#>  $ axis.ticks.length.r             : NULL
#>  $ axis.minor.ticks.length         : 'rel' num 0.75
#>  $ axis.minor.ticks.length.x       : NULL
#>  $ axis.minor.ticks.length.x.top   : NULL
#>  $ axis.minor.ticks.length.x.bottom: NULL
#>  $ axis.minor.ticks.length.y       : NULL
#>  $ axis.minor.ticks.length.y.left  : NULL
#>  $ axis.minor.ticks.length.y.right : NULL
#>  $ axis.minor.ticks.length.theta   : NULL
#>  $ axis.minor.ticks.length.r       : NULL
#>  $ axis.line                       : <ggplot2::element_blank>
#>  $ axis.line.x                     : NULL
#>  $ axis.line.x.top                 : NULL
#>  $ axis.line.x.bottom              : NULL
#>  $ axis.line.y                     : NULL
#>  $ axis.line.y.left                : NULL
#>  $ axis.line.y.right               : NULL
#>  $ axis.line.theta                 : NULL
#>  $ axis.line.r                     : NULL
#>  $ legend.background               : <ggplot2::element_rect>
#>   ..@ fill         : NULL
#>   ..@ colour       : logi NA
#>   ..@ linewidth    : NULL
#>   ..@ linetype     : NULL
#>   ..@ linejoin     : NULL
#>   ..@ inherit.blank: logi TRUE
#>  $ legend.margin                   : NULL
#>  $ legend.spacing                  : 'rel' num 2
#>  $ legend.spacing.x                : NULL
#>  $ legend.spacing.y                : NULL
#>  $ legend.key                      : <ggplot2::element_blank>
#>  $ legend.key.size                 : 'simpleUnit' num 1.5lines
#>   ..- attr(*, "unit")= int 3
#>  $ legend.key.height               : NULL
#>  $ legend.key.width                : 'simpleUnit' num 2lines
#>   ..- attr(*, "unit")= int 3
#>  $ legend.key.spacing              : NULL
#>  $ legend.key.spacing.x            : NULL
#>  $ legend.key.spacing.y            : NULL
#>  $ legend.key.justification        : NULL
#>  $ legend.frame                    : NULL
#>  $ legend.ticks                    : NULL
#>  $ legend.ticks.length             : 'rel' num 0.2
#>  $ legend.axis.line                : NULL
#>  $ legend.text                     : <ggplot2::element_text>
#>   ..@ family       : NULL
#>   ..@ face         : NULL
#>   ..@ italic       : chr NA
#>   ..@ fontweight   : num NA
#>   ..@ fontwidth    : num NA
#>   ..@ colour       : NULL
#>   ..@ size         : num 12
#>   ..@ hjust        : NULL
#>   ..@ vjust        : NULL
#>   ..@ angle        : NULL
#>   ..@ lineheight   : NULL
#>   ..@ margin       : NULL
#>   ..@ debug        : NULL
#>   ..@ inherit.blank: logi FALSE
#>  $ legend.text.position            : NULL
#>  $ legend.title                    : <ggplot2::element_blank>
#>  $ legend.title.position           : NULL
#>  $ legend.position                 : chr "right"
#>  $ legend.position.inside          : NULL
#>  $ legend.direction                : NULL
#>  $ legend.byrow                    : NULL
#>  $ legend.justification            : chr "center"
#>  $ legend.justification.top        : NULL
#>  $ legend.justification.bottom     : NULL
#>  $ legend.justification.left       : NULL
#>  $ legend.justification.right      : NULL
#>  $ legend.justification.inside     : NULL
#>   [list output truncated]
#>  @ complete: logi TRUE
#>  @ validate: logi TRUE
yourplot + jtools::theme_apa()