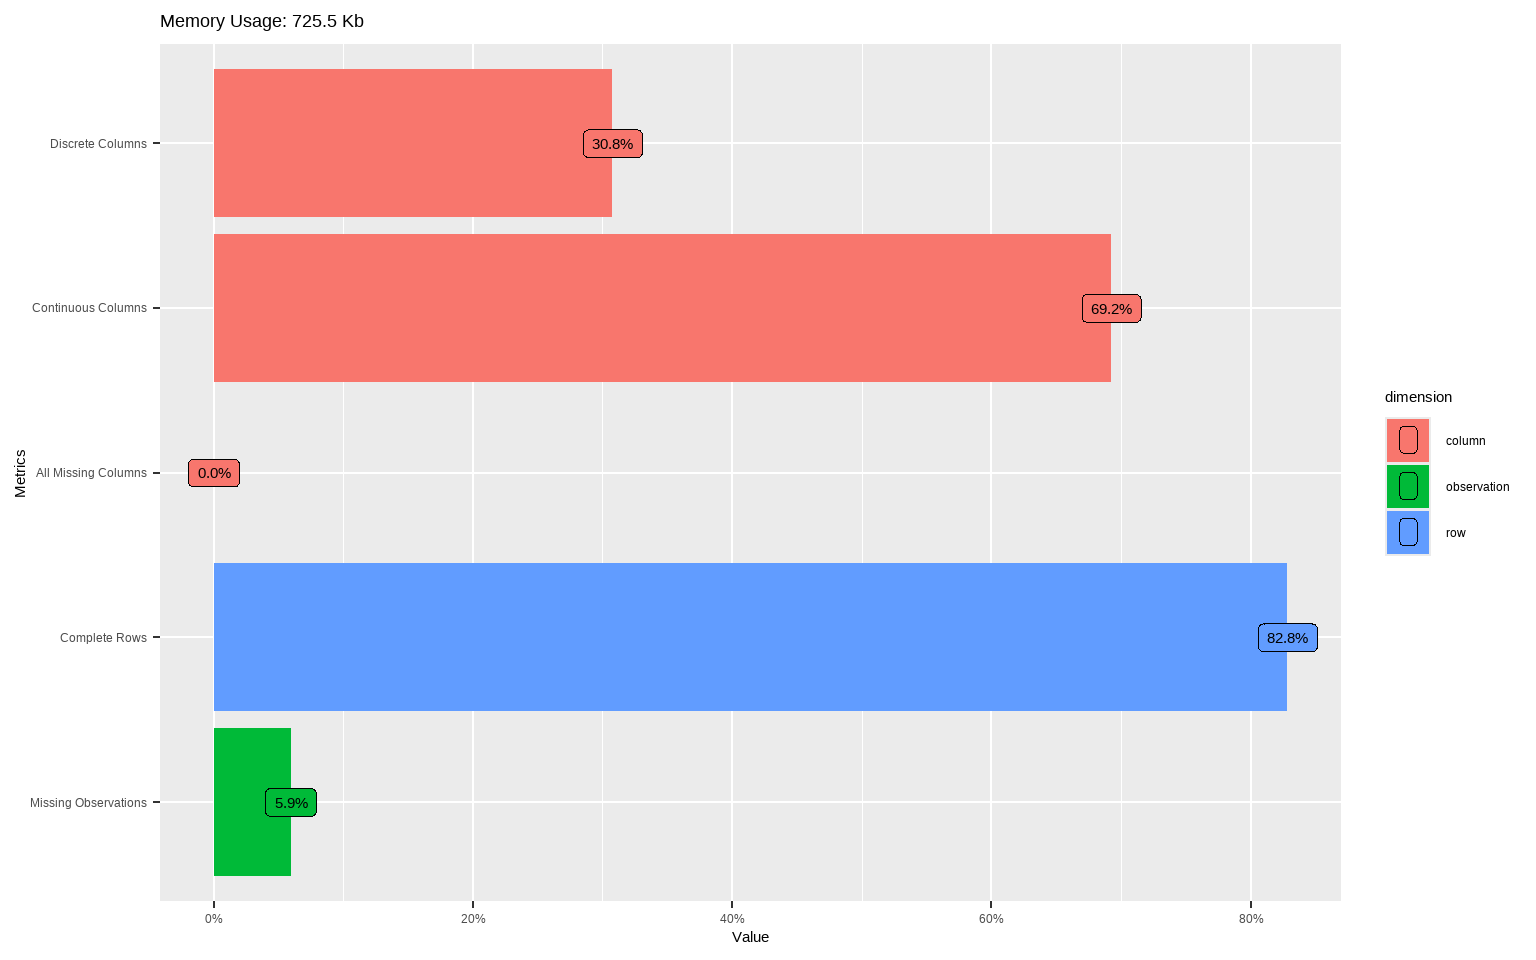
41.1 Data Report
Automate a first-pass profile to see dimensions, types, basic completeness, and distributions.
# Quick distribution sweep for numerics (great to spot skew and heavy tails)
plot_histogram(tx, ncol = 3L)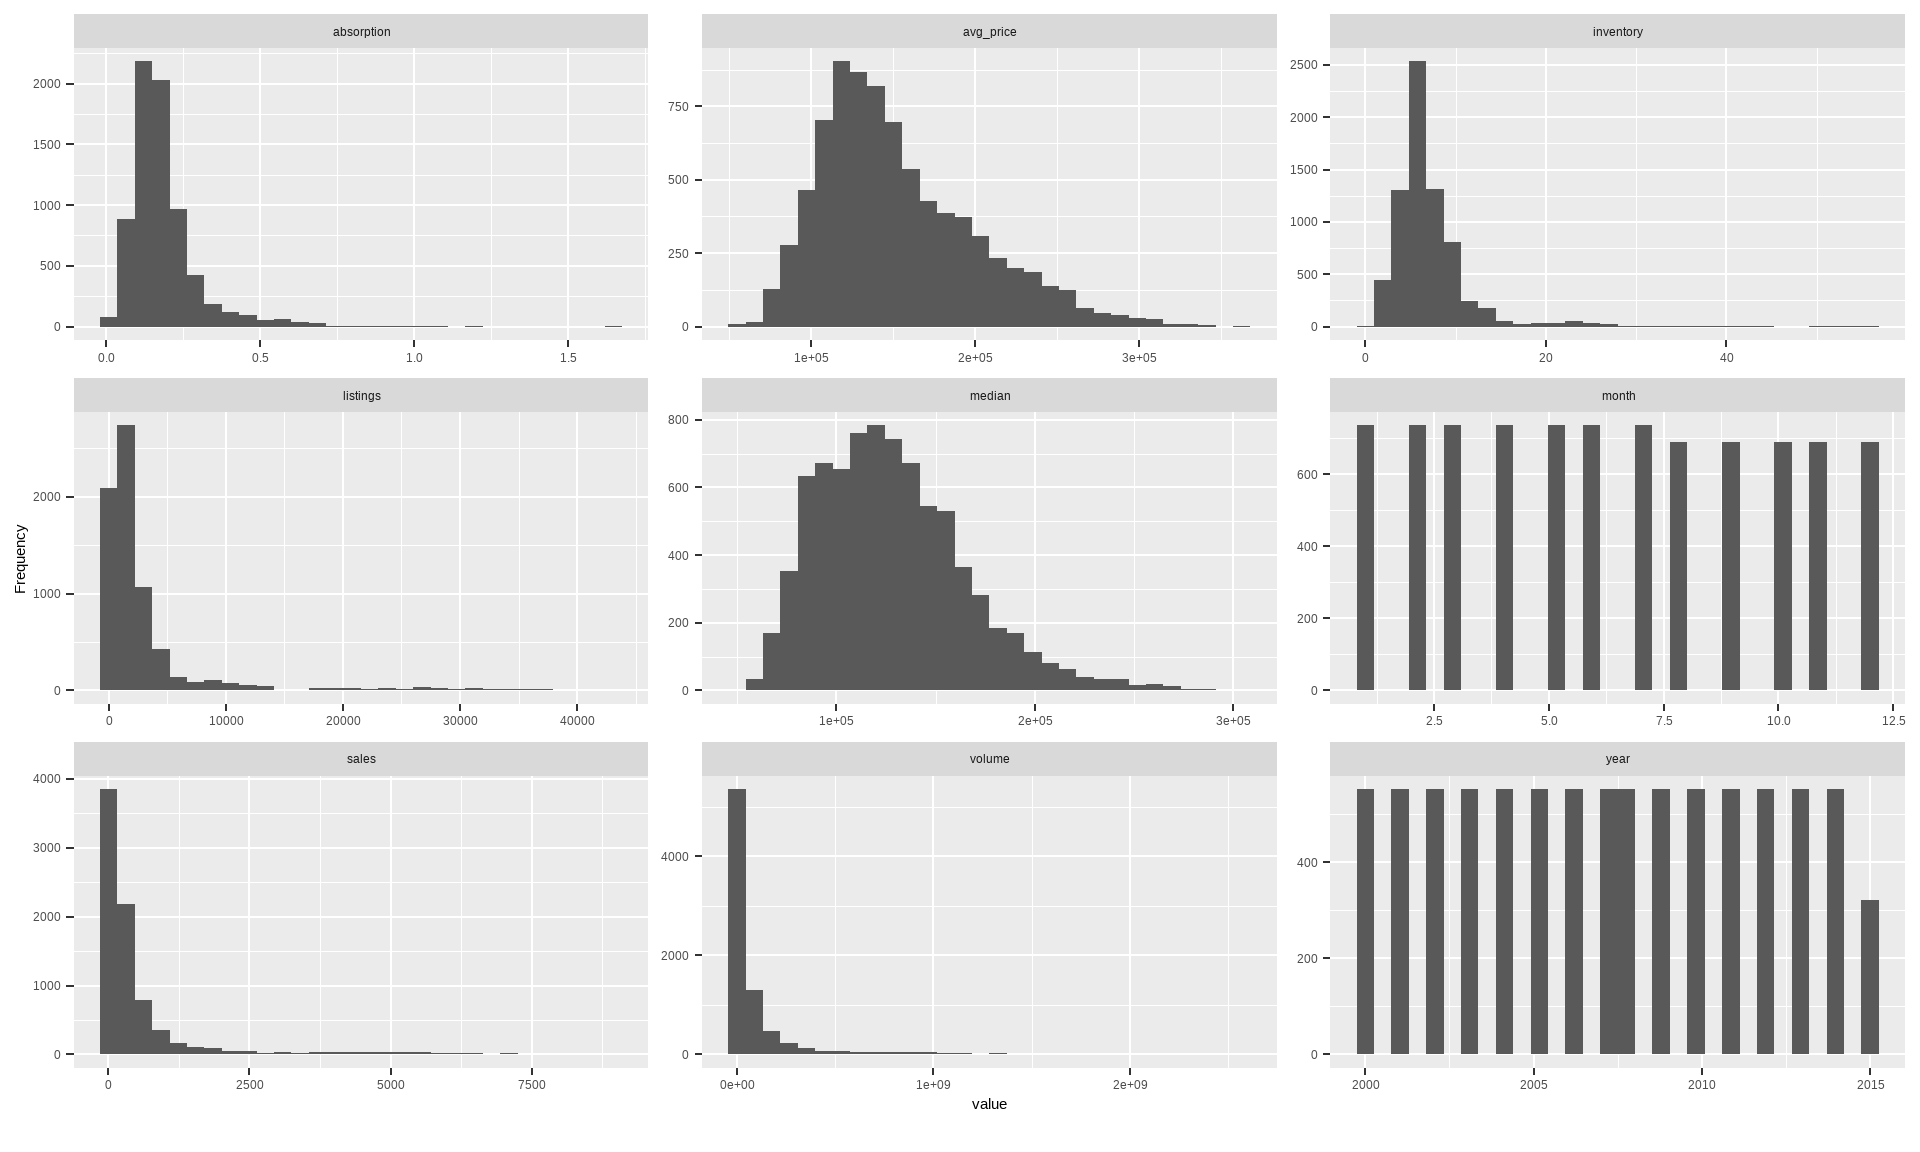
# Pairwise correlations (continuous); useful for multicollinearity hints
# Note: if your dataset has many numerics, set cor_args = list(use = "pairwise.complete.obs")
plot_correlation(tx, type = "continuous")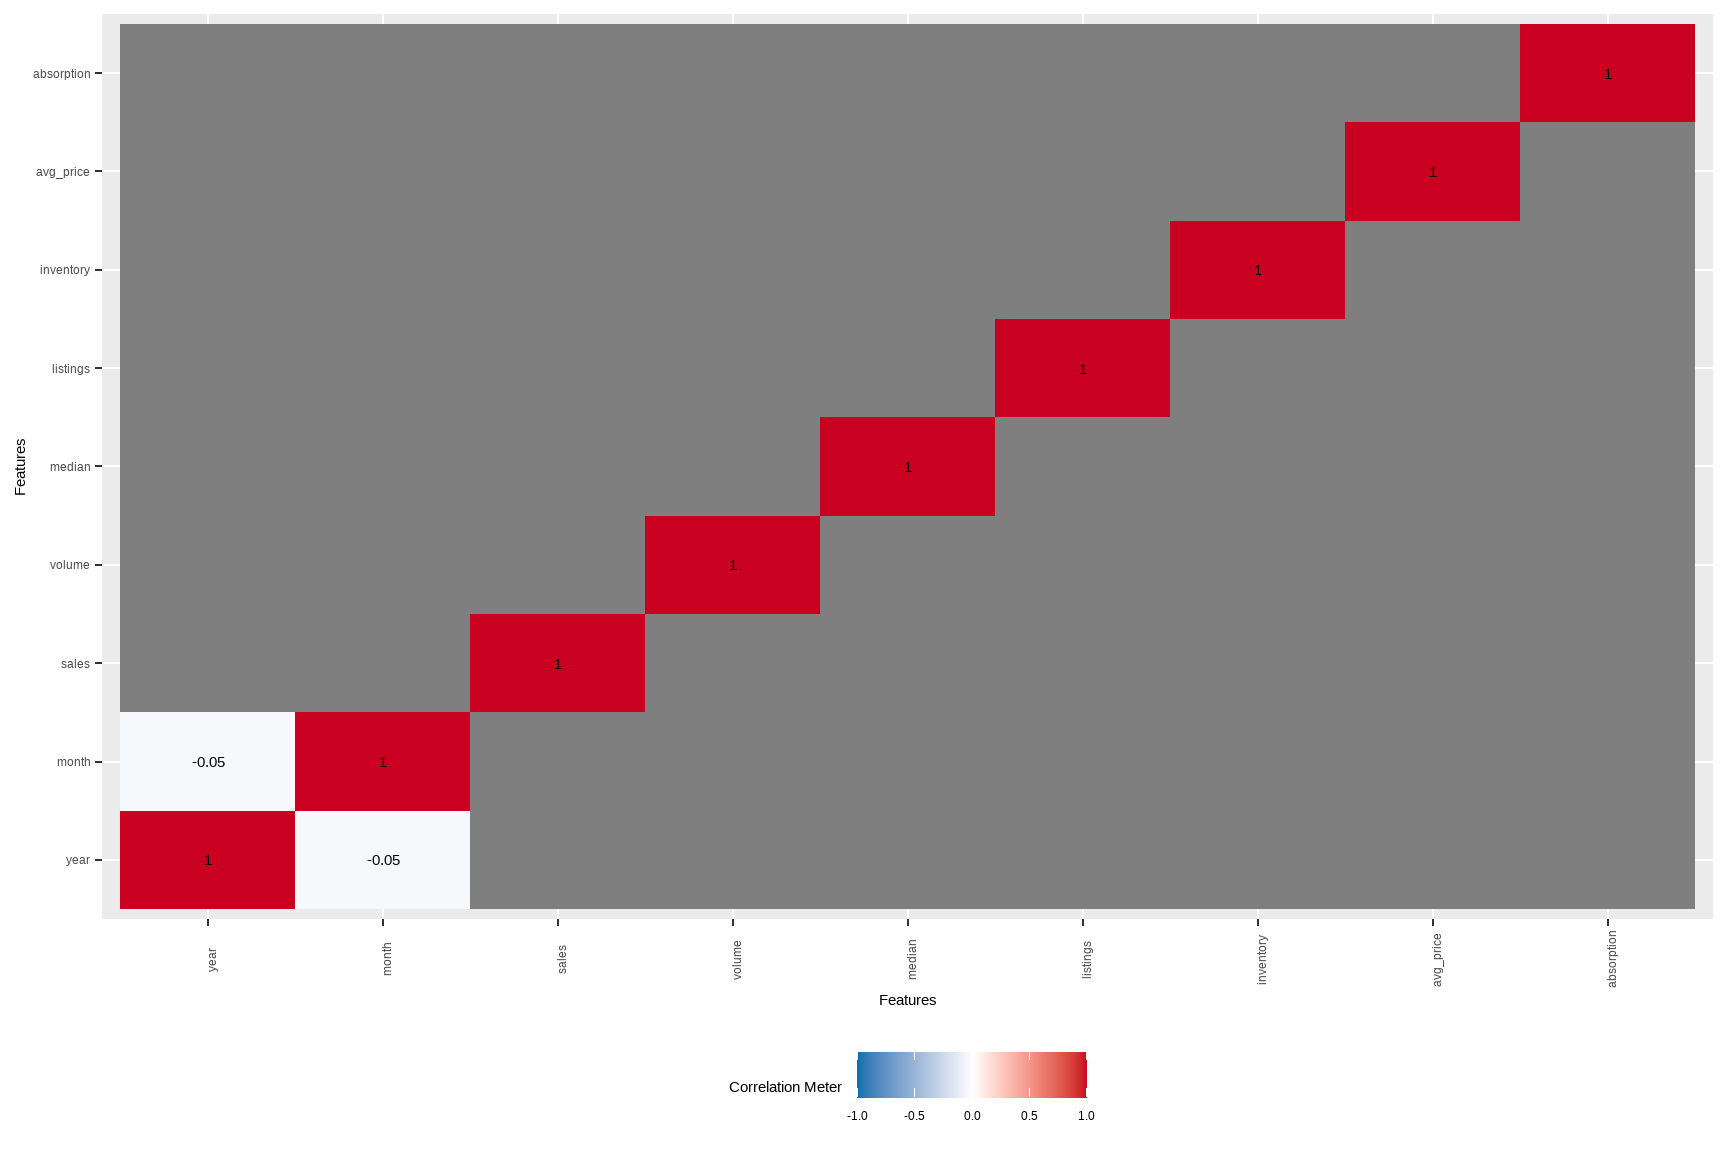
# If you want correlations/associations among discrete variables:
# (city and quarter here; may be high-cardinality)
plot_correlation(tx %>% select(city, quarter), type = "discrete")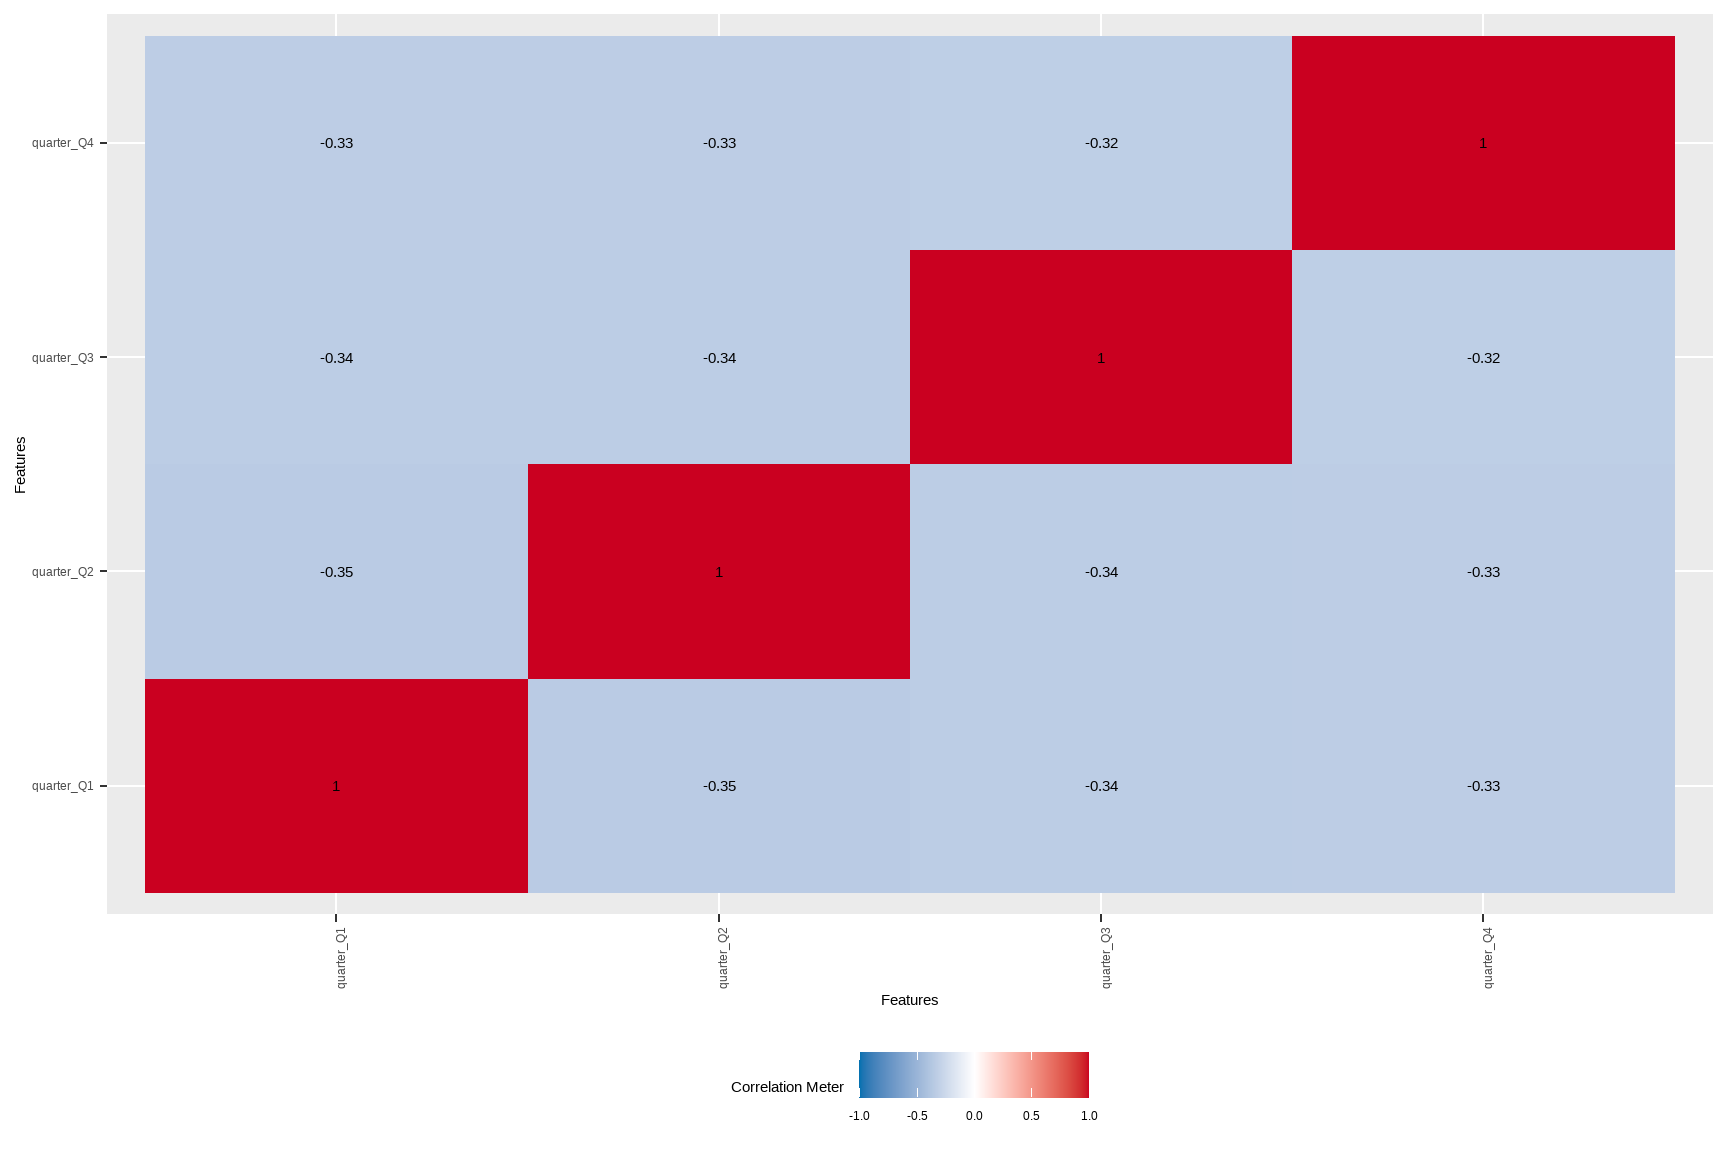
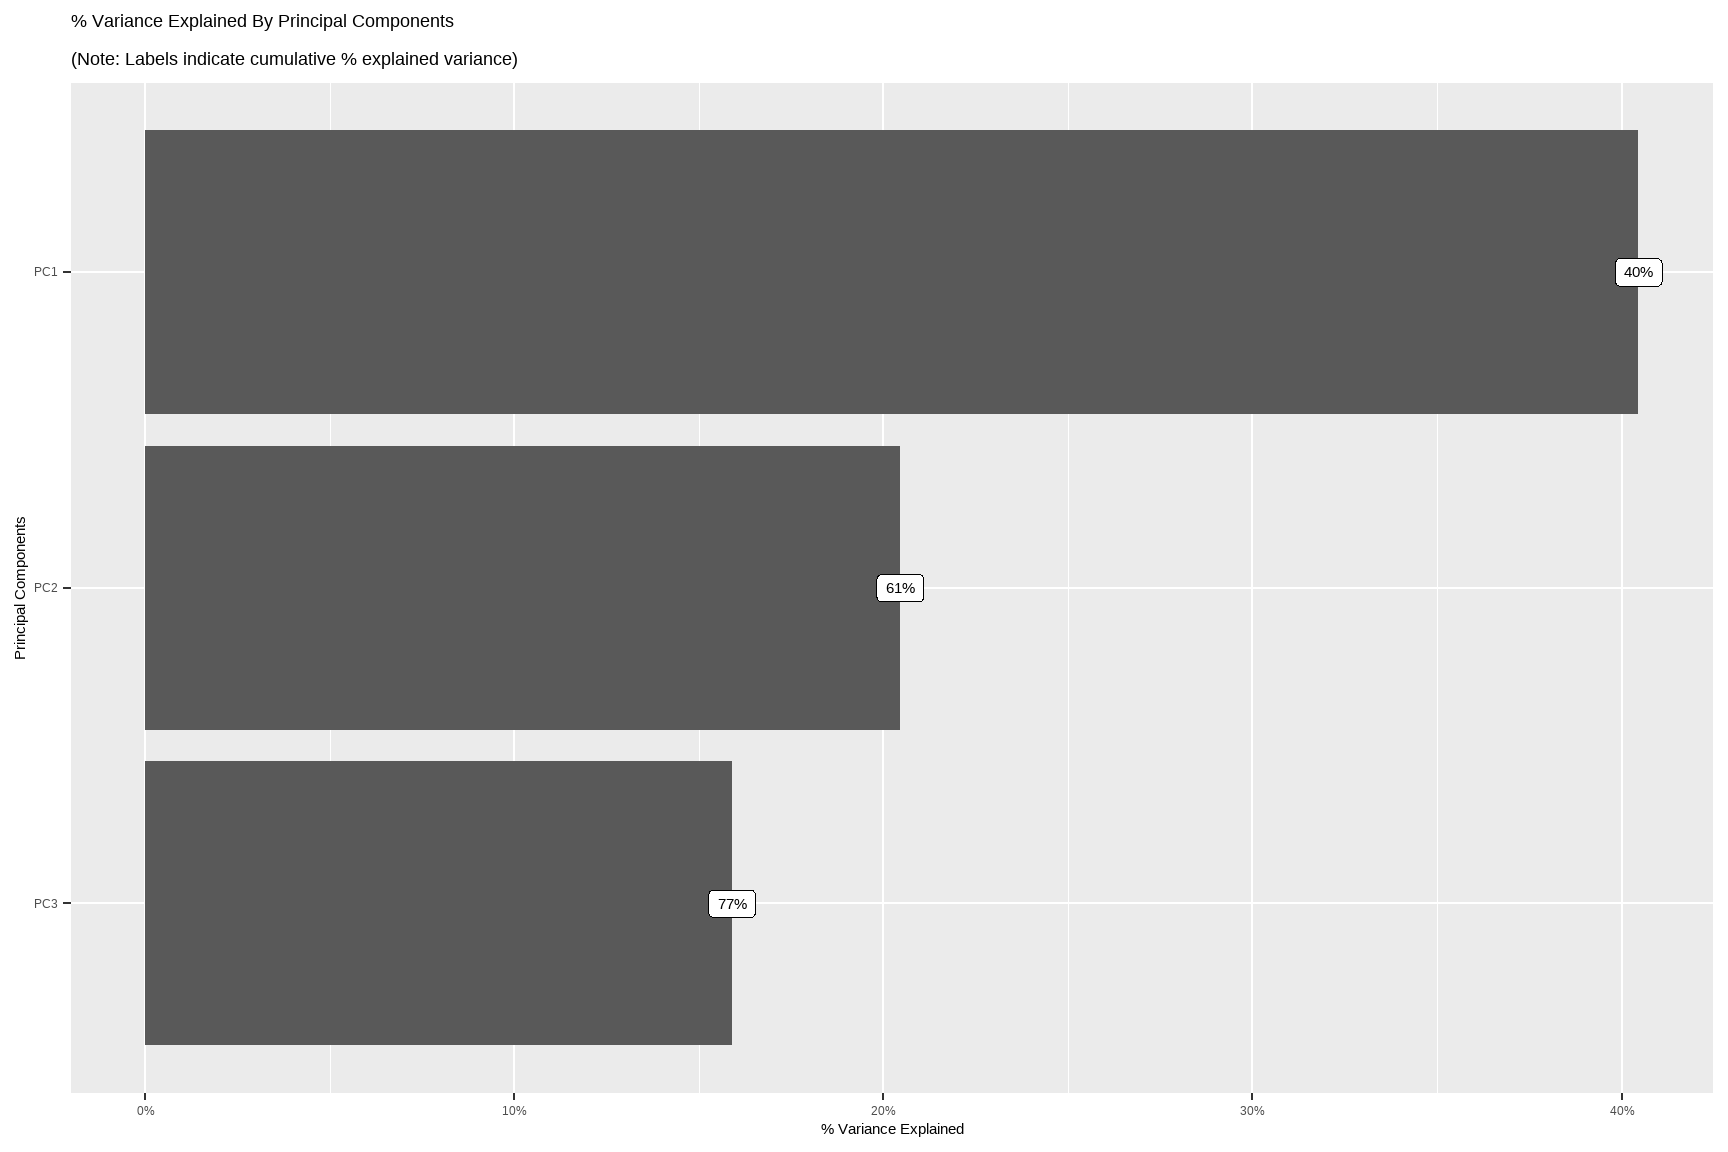
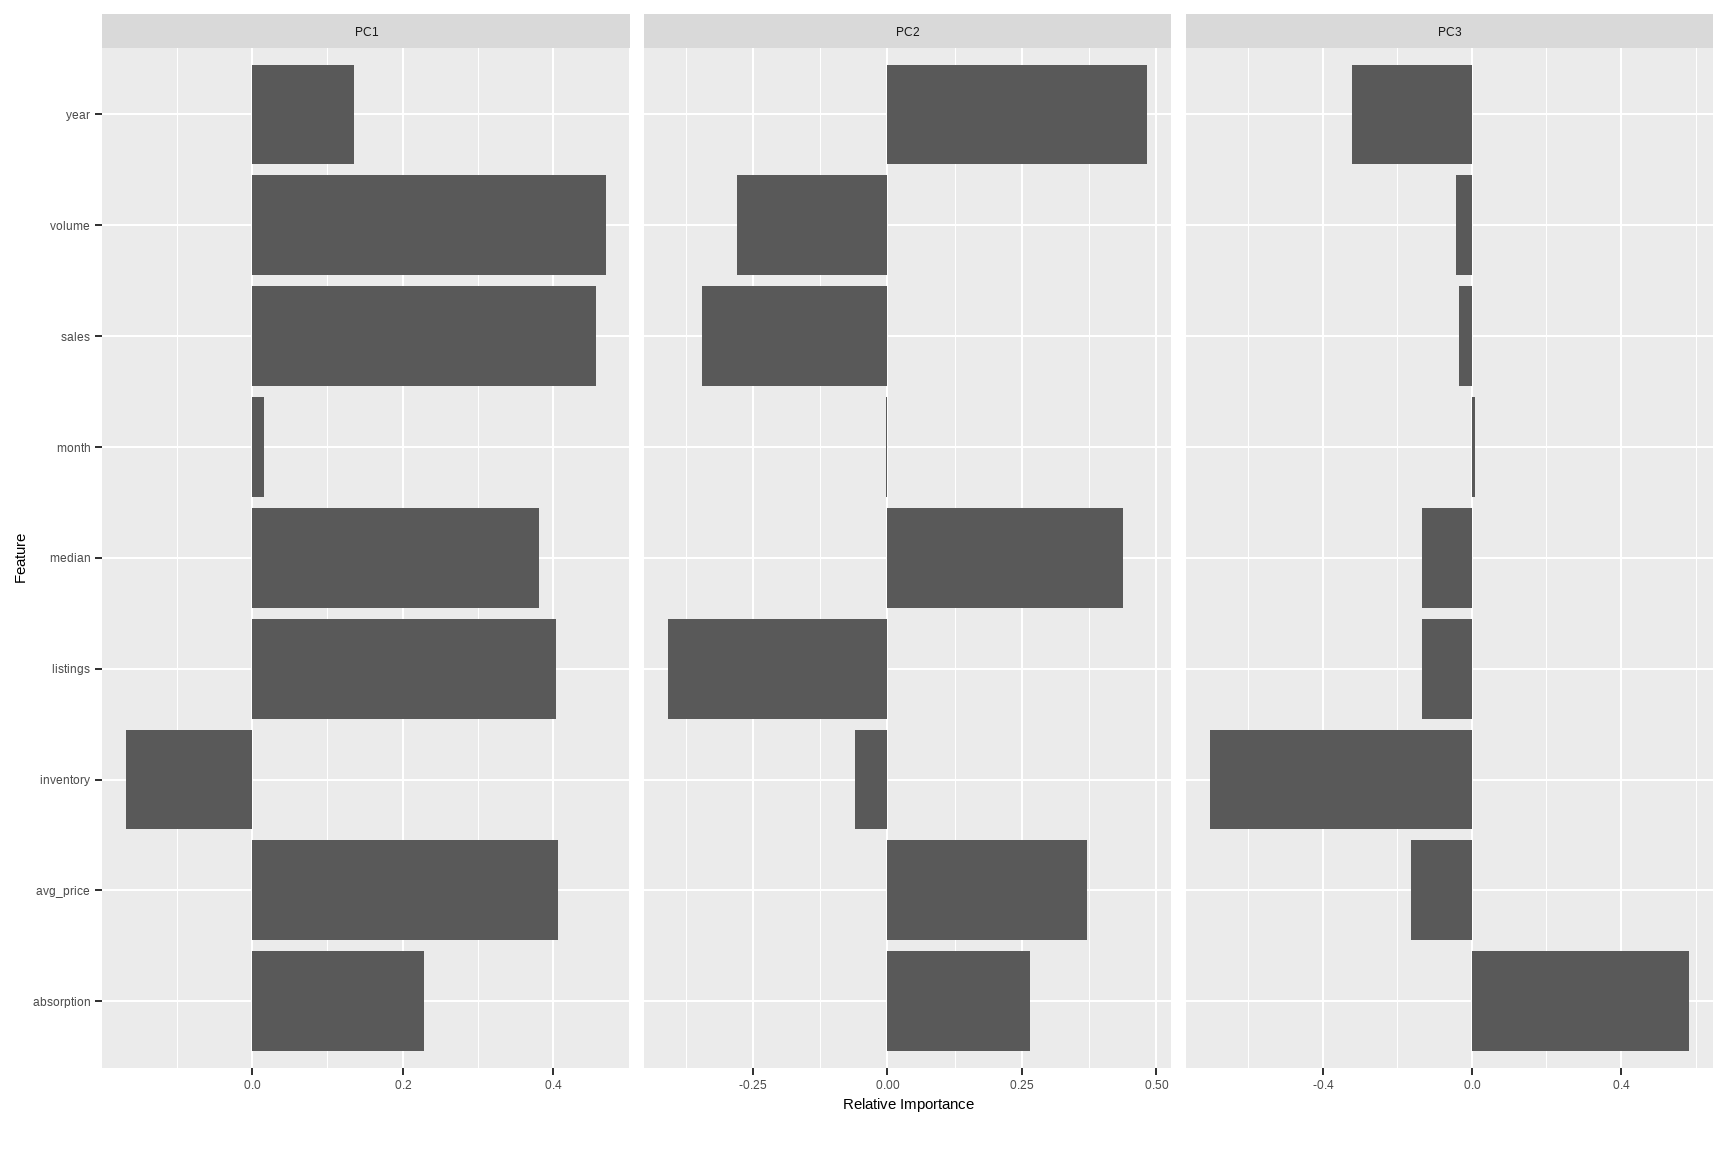
# Quick PCA map for continuous variables (after standardizing)
DataExplorer::plot_prcomp(tx %>%
  select(where(is.numeric)) %>%
  na.omit()
)
Tip: For very wide tables, use maxcat in DataExplorer functions to cap cardinality for cleaner plots.