7.6 Quasi-Poisson Regression
Poisson regression assumes that the mean and variance are equal:
\[ \text{Var}(Y_i) = E(Y_i) = \mu_i \]
However, many real-world datasets exhibit overdispersion, where the variance exceeds the mean:
\[ \text{Var}(Y_i) = \phi \mu_i \]
where \(\phi\) (the dispersion parameter) allows the variance to scale beyond the Poisson assumption.
To correct for this, we use Quasi-Poisson regression, which:
Follows the Generalized Linear Models structure but is not a strict GLM.
Uses a variance function proportional to the mean: \(\text{Var}(Y_i) = \phi \mu_i\).
Does not assume a specific probability distribution, unlike Poisson or Negative Binomial models.
7.6.1 Is Quasi-Poisson Regression a Generalized Linear Model?
✅ Yes, Quasi-Poisson is GLM-like:
Linear Predictor: Like Poisson regression, it models the log of the expected count as a function of predictors: \[ \log(E(Y)) = X\beta \]
Canonical Link Function: It typically uses a log link function, just like standard Poisson regression.
Variance Structure: Unlike standard Poisson, which assumes \(\text{Var}(Y) = E(Y)\), Quasi-Poisson allows for overdispersion: \[ \text{Var}(Y) = \phi E(Y) \] where \(\phi\) is estimated rather than assumed to be 1.
❌ No, Quasi-Poisson is not a strict GLM because:
GLMs require a full probability distribution from the exponential family.
Standard Poisson regression assumes a Poisson distribution (which belongs to the exponential family).
Quasi-Poisson does not assume a full probability distribution, only a mean-variance relationship.
It does not use Maximum Likelihood Estimation.
Standard GLMs use MLE to estimate parameters.
Quasi-Poisson uses quasi-likelihood methods, which require specifying only the mean and variance, but not a full likelihood function.
Likelihood-based inference is not valid.
- AIC, BIC, and Likelihood Ratio Tests cannot be used with Quasi-Poisson regression.
When to Use Quasi-Poisson:
When data exhibit overdispersion (variance > mean), making standard Poisson regression inappropriate.
When Negative Binomial Regression is not preferred, but an alternative is needed to handle overdispersion.
If overdispersion is present, Negative Binomial Regression is often a better alternative because it is a true GLM with a full likelihood function, whereas Quasi-Poisson is only a quasi-likelihood approach.
7.6.2 Application: Quasi-Poisson Regression
We analyze the bioChemists dataset, modeling the number of published articles (Num_Article) as a function of various predictors.
7.6.2.1 Checking Overdispersion in the Poisson Model
We first fit a Poisson regression model and check for overdispersion using the deviance-to-degrees-of-freedom ratio:
# Fit Poisson regression model
Poisson_Mod <-
    glm(Num_Article ~ ., family = poisson, data = bioChemists)

# Compute dispersion parameter
dispersion_estimate <-
    Poisson_Mod$deviance / Poisson_Mod$df.residual
dispersion_estimate
#> [1] 1.797988
If \(\hat{\phi} > 1\), the Poisson model underestimates variance.
A large value (>> 1) suggests that Poisson regression is not appropriate.
7.6.2.2 Fitting the Quasi-Poisson Model
Since overdispersion is present, we refit the model using Quasi-Poisson regression, which scales standard errors by \(\phi\).
# Fit Quasi-Poisson regression model
quasiPoisson_Mod <-
    glm(Num_Article ~ ., family = quasipoisson, data = bioChemists)

# Summary of the model
summary(quasiPoisson_Mod)
#>
#> Call:
#> glm(formula = Num_Article ~ ., family = quasipoisson, data = bioChemists)
#>
#> Coefficients:
#>                  Estimate Std. Error t value Pr(>|t|)
#> (Intercept)      0.304617   0.139273   2.187 0.028983 *
#> SexWomen        -0.224594   0.073860  -3.041 0.002427 **
#> MarriedMarried   0.155243   0.083003   1.870 0.061759 .
#> Num_Kid5        -0.184883   0.054268  -3.407 0.000686 ***
#> PhD_Quality      0.012823   0.035700   0.359 0.719544
#> Num_MentArticle  0.025543   0.002713   9.415  < 2e-16 ***
#> ---
#> Signif. codes:  0 '***' 0.001 '**' 0.01 '*' 0.05 '.' 0.1 ' ' 1
#>
#> (Dispersion parameter for quasipoisson family taken to be 1.829006)
#>
#>     Null deviance: 1817.4  on 914  degrees of freedom
#> Residual deviance: 1634.4  on 909  degrees of freedom
#> AIC: NA
#>
#> Number of Fisher Scoring iterations: 5
Interpretation:
The coefficients remain the same as in Poisson regression.
Standard errors are inflated to account for overdispersion.
P-values increase, leading to more conservative inference.
7.6.2.3 Comparing Poisson and Quasi-Poisson
To see the effect of using Quasi-Poisson, we compare standard errors:
# Extract coefficients and standard errors
poisson_se <- summary(Poisson_Mod)$coefficients[, 2]
quasi_se <- summary(quasiPoisson_Mod)$coefficients[, 2]

# Compare standard errors
se_comparison <- data.frame(Poisson = poisson_se,
                            Quasi_Poisson = quasi_se)
se_comparison
#>                     Poisson Quasi_Poisson
#> (Intercept)     0.102981443   0.139272885
#> SexWomen        0.054613488   0.073859696
#> MarriedMarried  0.061374395   0.083003199
#> Num_Kid5        0.040126898   0.054267922
#> PhD_Quality     0.026397045   0.035699564
#> Num_MentArticle 0.002006073   0.002713028
Quasi-Poisson has larger standard errors than Poisson.
This leads to wider confidence intervals, reducing the likelihood of false positives.
7.6.2.4 Model Diagnostics: Checking Residuals
We examine residuals to assess model fit:
# Residual plot
plot(
    quasiPoisson_Mod$fitted.values,
    residuals(quasiPoisson_Mod, type = "pearson"),
    xlab = "Fitted Values",
    ylab = "Pearson Residuals",
    main = "Residuals vs. Fitted Values (Quasi-Poisson)"
)
abline(h = 0, col = "red")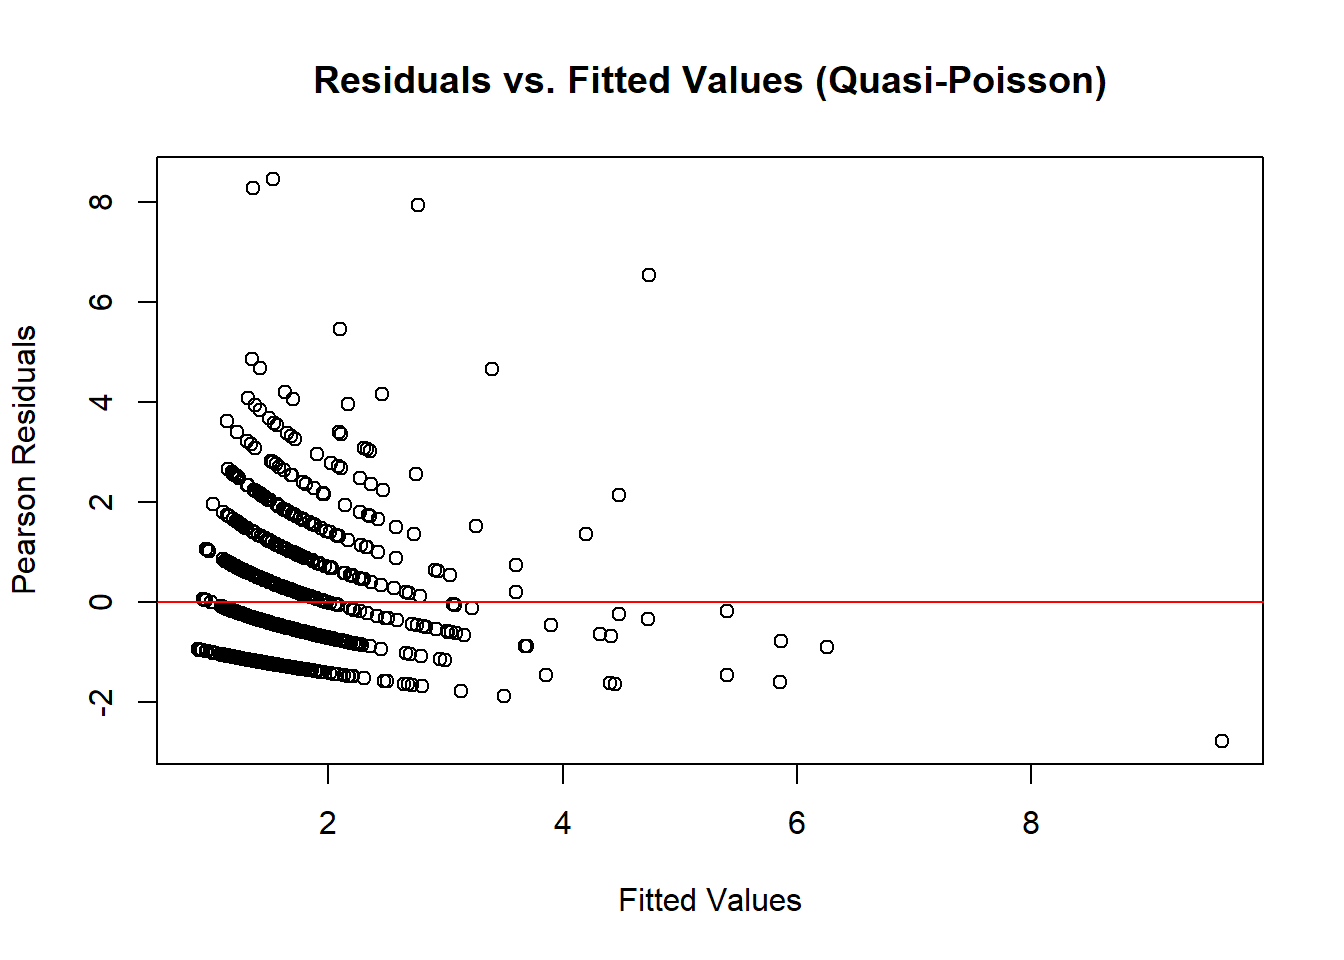
Figure 7.8: Residuals vs. Fitted Values (Quasi-Poisson)
If residuals show a pattern, additional predictors or transformations may be needed.
Random scatter around zero suggests a well-fitting model.
7.6.2.5 Alternative: Negative Binomial vs. Quasi-Poisson
If overdispersion is severe, Negative Binomial regression may be preferable because it explicitly models dispersion:
# Fit Negative Binomial model
library(MASS)
NegBinom_Mod <- glm.nb(Num_Article ~ ., data = bioChemists)

# Model summaries
summary(quasiPoisson_Mod)
#>
#> Call:
#> glm(formula = Num_Article ~ ., family = quasipoisson, data = bioChemists)
#>
#> Coefficients:
#>                  Estimate Std. Error t value Pr(>|t|)
#> (Intercept)      0.304617   0.139273   2.187 0.028983 *
#> SexWomen        -0.224594   0.073860  -3.041 0.002427 **
#> MarriedMarried   0.155243   0.083003   1.870 0.061759 .
#> Num_Kid5        -0.184883   0.054268  -3.407 0.000686 ***
#> PhD_Quality      0.012823   0.035700   0.359 0.719544
#> Num_MentArticle  0.025543   0.002713   9.415  < 2e-16 ***
#> ---
#> Signif. codes:  0 '***' 0.001 '**' 0.01 '*' 0.05 '.' 0.1 ' ' 1
#>
#> (Dispersion parameter for quasipoisson family taken to be 1.829006)
#>
#>     Null deviance: 1817.4  on 914  degrees of freedom
#> Residual deviance: 1634.4  on 909  degrees of freedom
#> AIC: NA
#>
#> Number of Fisher Scoring iterations: 5
summary(NegBinom_Mod)
#>
#> Call:
#> glm.nb(formula = Num_Article ~ ., data = bioChemists, init.theta = 2.264387695,
#>     link = log)
#>
#> Coefficients:
#>                  Estimate Std. Error z value Pr(>|z|)
#> (Intercept)      0.256144   0.137348   1.865 0.062191 .
#> SexWomen        -0.216418   0.072636  -2.979 0.002887 **
#> MarriedMarried   0.150489   0.082097   1.833 0.066791 .
#> Num_Kid5        -0.176415   0.052813  -3.340 0.000837 ***
#> PhD_Quality      0.015271   0.035873   0.426 0.670326
#> Num_MentArticle  0.029082   0.003214   9.048  < 2e-16 ***
#> ---
#> Signif. codes:  0 '***' 0.001 '**' 0.01 '*' 0.05 '.' 0.1 ' ' 1
#>
#> (Dispersion parameter for Negative Binomial(2.2644) family taken to be 1)
#>
#>     Null deviance: 1109.0  on 914  degrees of freedom
#> Residual deviance: 1004.3  on 909  degrees of freedom
#> AIC: 3135.9
#>
#> Number of Fisher Scoring iterations: 1
#>
#>
#>               Theta:  2.264
#>           Std. Err.:  0.271
#>
#>  2 x log-likelihood:  -3121.917
7.6.2.6 Key Differences: Quasi-Poisson vs. Negative Binomial
| Feature | Quasi-Poisson | Negative Binomial |
|---|---|---|
| Handles Overdispersion? | ✅ Yes | ✅ Yes |
| Uses a Full Probability Distribution? | ❌ No | ✅ Yes |
| MLE-Based? | ❌ No (quasi-likelihood) | ✅ Yes |
| Can Use AIC/BIC for Model Selection? | ❌ No | ✅ Yes |
| Better for Model Interpretation? | ✅ Yes | ✅ Yes |
| Best for Severe Overdispersion? | ❌ No | ✅ Yes |
When to Choose:
Use Quasi-Poisson when you only need robust standard errors and do not require model selection via AIC/BIC.
Use Negative Binomial when overdispersion is large and you want a true likelihood-based model.
While Quasi-Poisson is a quick fix, Negative Binomial is generally the better choice for modeling count data with overdispersion.