25.3 Statistical Test Selection for Comparing Means

Flow chart depicting a decision tree for statistical test selection based on the number of dependent and independent variables. It starts with the number of dependent variables, branching into one or more. For one dependent variable, it further divides based on the number of independent variables, leading to tests like One-sample T-test, Pair-sample T-test, and ANOVA variations. For two or more dependent variables, it considers whether dependent variables are repeated measures, leading to MANOVA or repeated measures MANOVA. The chart guides the selection of appropriate statistical tests.

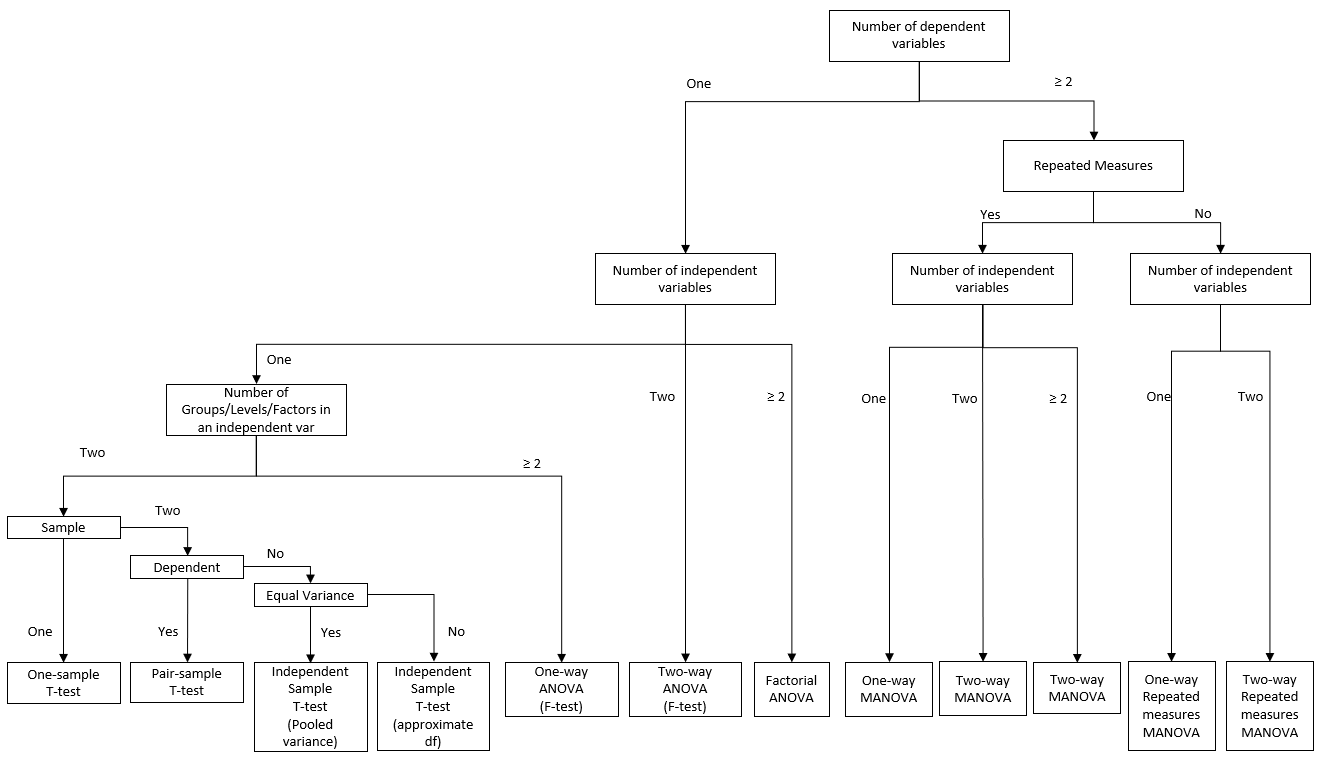
Figure 25.2: Statistical Test Selection for Comparing Means