34.2 Using software
Software is used to compute the value of \(r\). For the red deer data (Fig. 33.2), the relationship is approximately linear, and the jamovi output (Fig. 34.5) and SPSS output (Fig. 34.6) show that \(r = -0.584\):
- Direction: The sign of \(r\) indicates the direction. Here we see a negative relationship: Higher ages are associated with lighter molars (in general), which makes sense.
- Variation: The value of \(r\) indicates the strength of the relationship. Here, perhaps we could describe the variation as moderate.
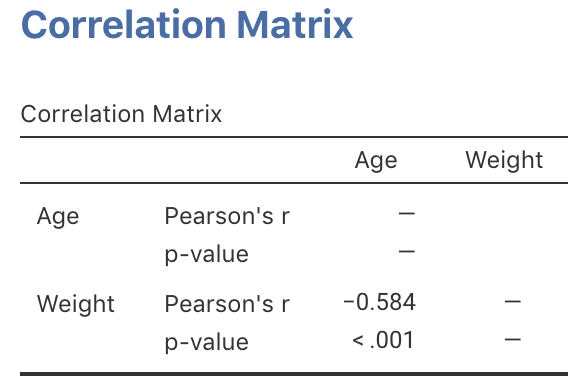
FIGURE 34.5: jamovi correlation output for the red deer data
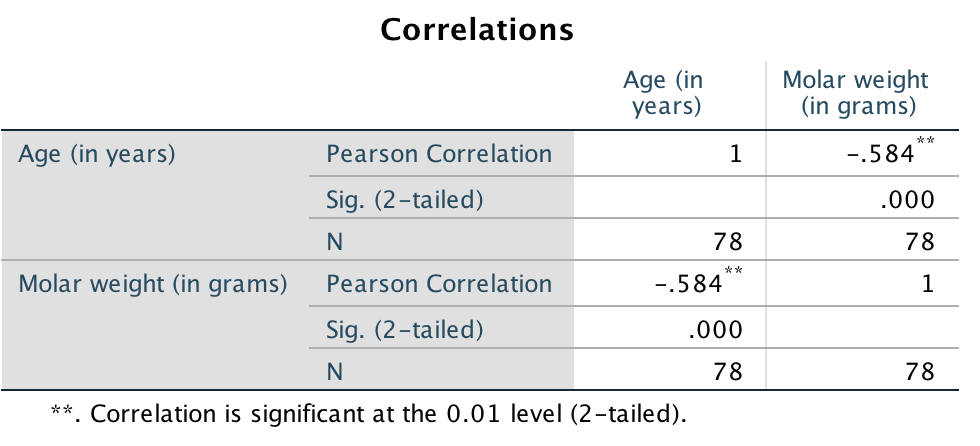
FIGURE 34.6: SPSS correlation output for the red deer data