34.3 R-squared (\(R^2\))
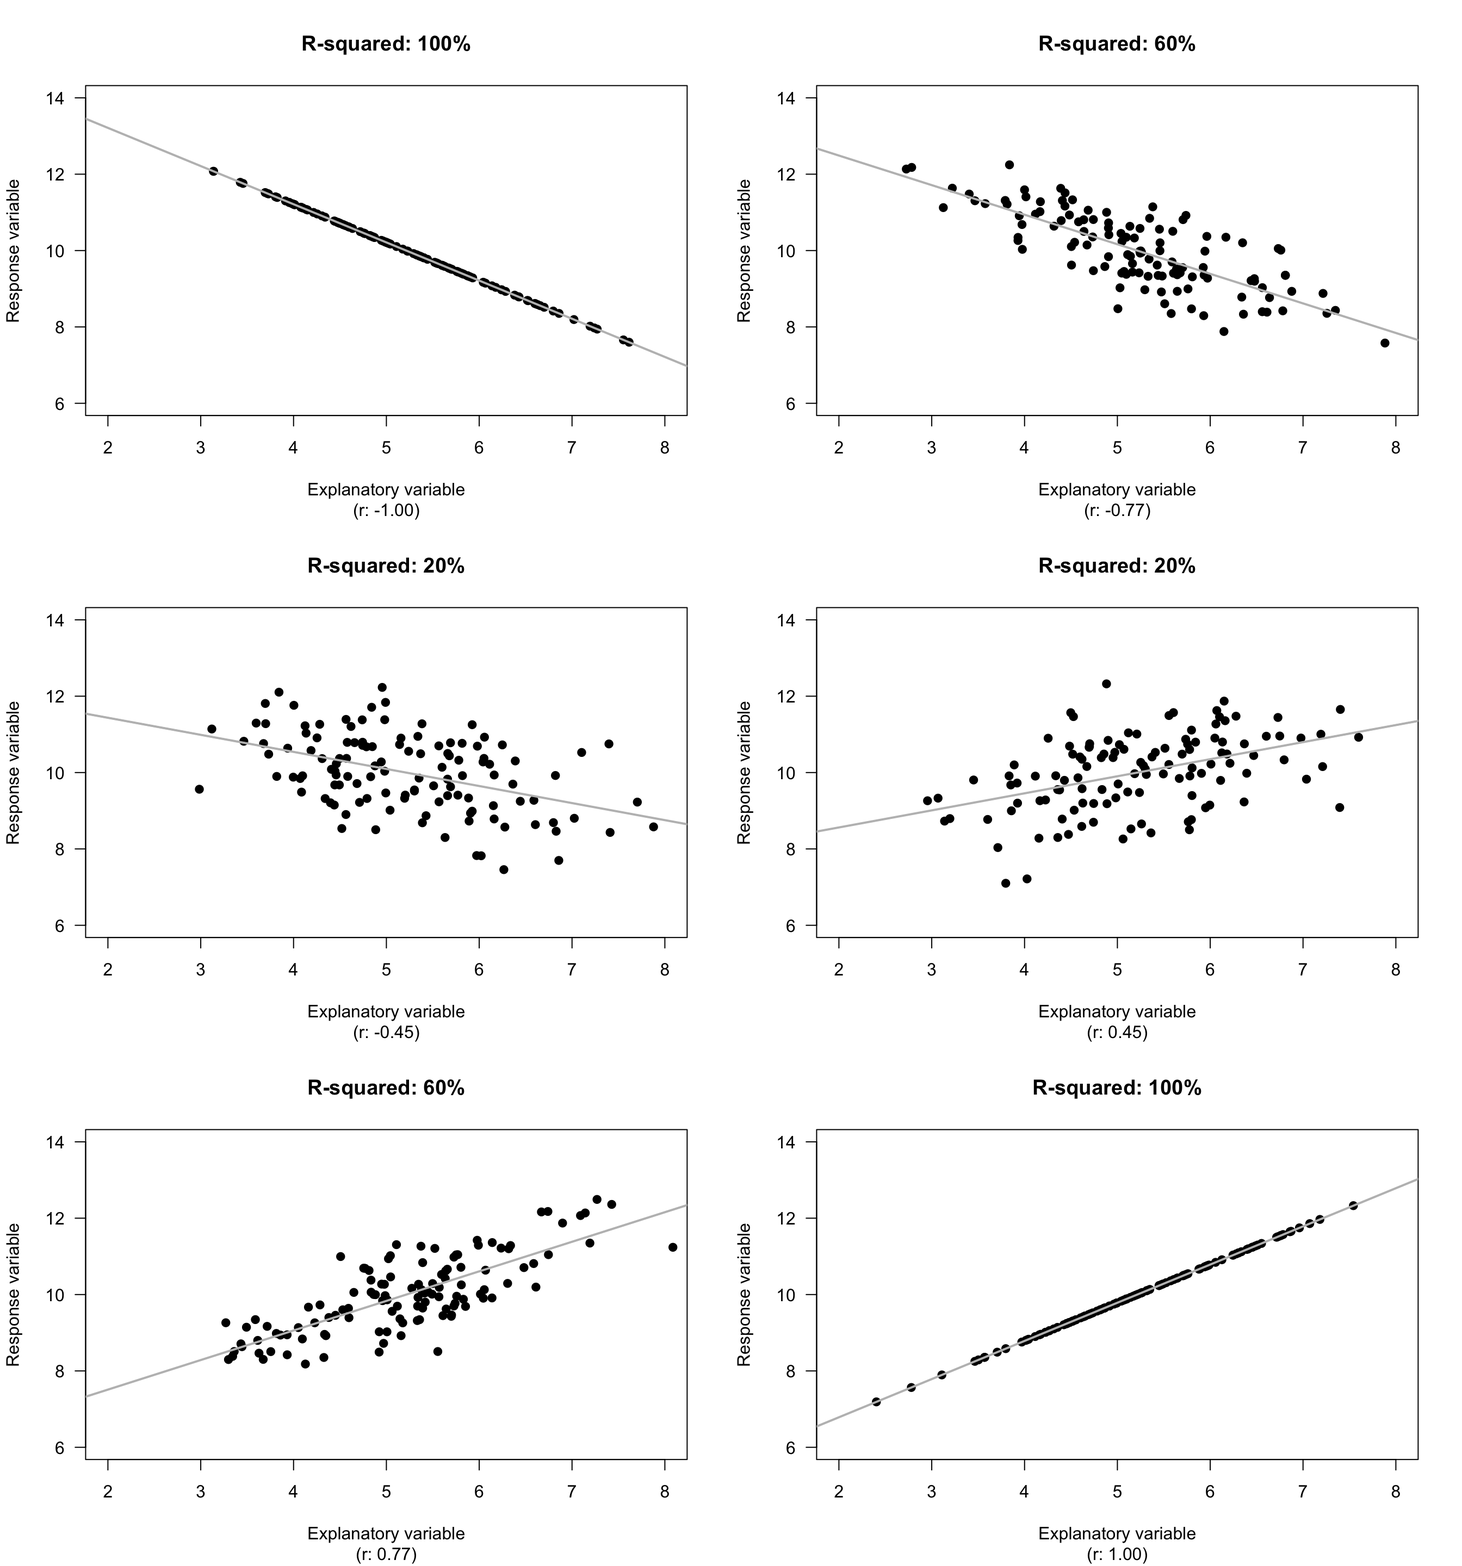
While using \(r\) tells us about the strength and direction of the linear relationship, knowing exactly what the value means is tricky. Interpretation is easier using \(R^2\), or ‘R-squared’: the square of the value of \(r\).
The animation below shows some values of \(R^2\).
The value of \(R^2\) is never negative. However, you need to be careful when using your calculator!
With most calculators,
if you enter -0.5^2, you will get -0.25 in return.
This is correct, because the calculator interprets your input as meaning
-(0.25^2).
(-0,5)^2.
This will give you the expected answer of 0.25.
##
## Attaching package: 'MASS'
## The following object is masked from 'package:dplyr':
##
## select## The following object is masked from 'package:plotly':
##
## select
The value of \(R^2\) is the percentage reduction in the unknown variation of \(y\) because the value of \(x\) is known. In other words, it is the percentage of the variation in \(y\) explained by using the linear relationship, rather than just the mean value of \(y\).
Example 34.4 (Values of \(R^2\)) For the red deer data (Fig. 33.2), the value of \(R^2\) from the software output (Fig. 34.5; Fig. 34.6) is \(R^2= (-0.584)^2 = 0.341\), usually written as a percentage: 34.1%.
The value of \(R^2\) is positive, even though the value of \(r\) is negative.For the red deer data, \(R^2\) means that about 34.1% of the variation in molar weights can be explained by variation in the age of the deer. The rest of the variation in molar weights is due to extraneous variables, such as weight, diet, amount of exercise, genetics, etc.
Think 34.3 (Interpreting \(R^2\)) From Example 34.3, the correlation coefficient between the systolic blood pressure and age in the NHANES data is \(r = 0.532\).
What is the value of \(R^2\)? What does it mean?