14.3 Odds ratios
To summarise the small kidney stone data:
- For Method A, the odds of success are 13.5; there are 13.5 times as many successes as failures. (Alternatively, there are 1350 successes for every 100 failures.)
- For Method B, the odds of success are 6.5; there are 6.5 times as many successes as failures. (Alternatively, there are 650 successes for every 100 failures.)
The odds of success for Method A and Method B are very different: in the sample, the odds of success for Method A is many times greater than for Method B. In fact, in the sample, the odds of success for Method A is
\[ \frac{13.5}{6.5} = 2.08 \]
times the odds of a success for Method B. This value is called the odds ratio (OR); see Fig. 14.2. The sample odds ratio is a statistic, and the population odds ratio is a parameter.

Understanding how software computes the odds ratio is important for understanding the output. jamovi and SPSS compute the odds ratio as either:
The odds compare Row 1 to Row 2, then the odds ratio compares the Row 1 odds to the Row 2 odds.
The odds compare Column 1 to Column 2, then the odds ratio compares the Column 1 odds to the Column 2 odds.
The OR compares the odds of an event in two groups. This means that a \(2\times 2\) table can be summarised using one number: the odds ratio (OR).
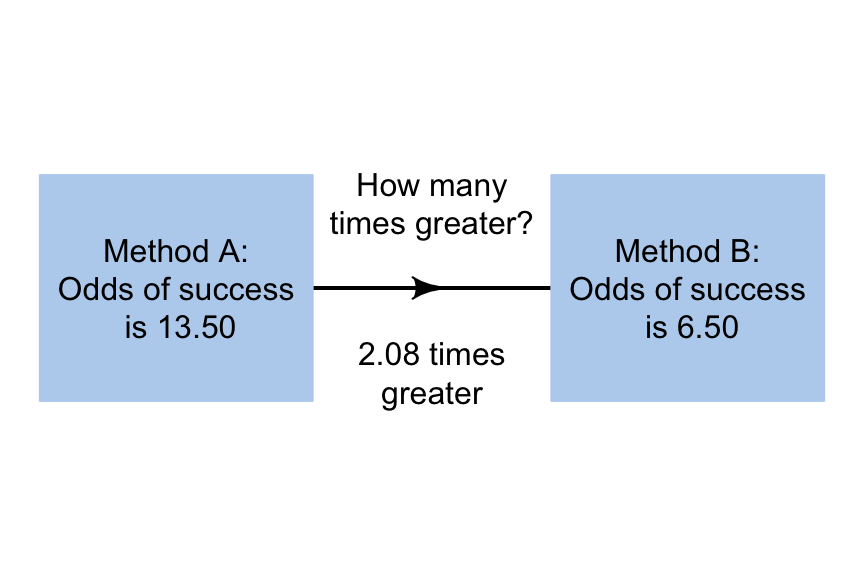
FIGURE 14.2: The odds ratio for the small kidney stones data
When using odds ratios (or ORs):
- When the odds ratio is greater than one: the odds of the event for the group in the top of the division is greater than the odds of the event for the group in the bottom of the division.
- When the odds ratio is equal to one: the odds of the event for the group in the top of the division is equal to the odds of the event for the group in the bottom of the division.
- When the odds ratio is less than one: the odds of the event for the group in the top of the division is less than the odds of the event for the group in the bottom of the division.
The following short video may help explain some of these concepts: