D.13 Answers: Numerical summaries for quantitative data
Answers to exercises in Sect. 13.10.
Answer to Exercise 13.1:
Probably the median as slightly skewed right, with some outliers.
Both the mean and median can be quoted…
Answer to Exercise 13.2:
1. Sample mean: 0.467.
2. Sample median: 3.35.
3. Range: 29.6 (from -19.8 to 9.8).
4. Sample standard deviation: 10.40263.
(SOI has no units of measurement.)
Answer to Exercise 13.3:
A: II (median; IQR).
B: I (mean; standard deviation).
C: III (median; IQR).
Answer to Exercise 13.4:
See Fig D.5.
Worker 2 is faster in general (more panels installed per minute),
including one fast outlier.
Workers 1 and 3 have similar medians,
but Worker 3 is more consistent (smaller IQR).
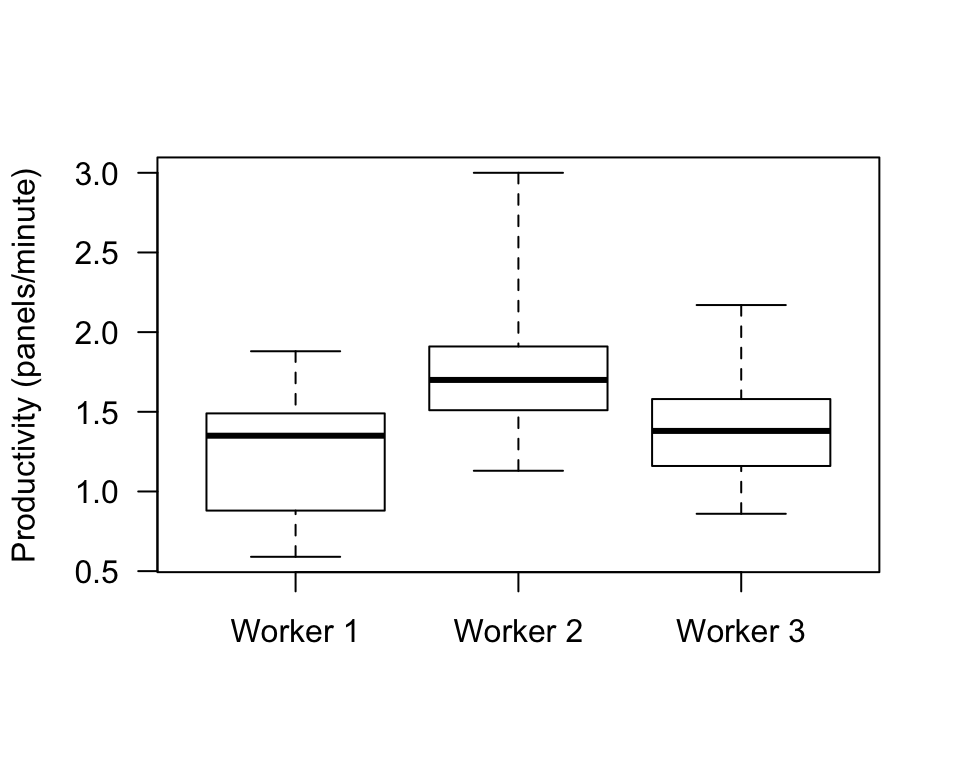
FIGURE D.5: The boxplot for the productivity data