25.4 Comparing odds: Confidence intervals
As noted, we rely on software to find the CI for the odds ratio, such as jamovi (Fig. 25.2) and the second table of the SPSS output (labelled Risk Estimate; Fig. 25.3). Both show that the sample OR is 5.94, and the (exact) 95% CI is from 1.35 to 26.1. (The SPSS output shows other information too, some of which will be useful later.)
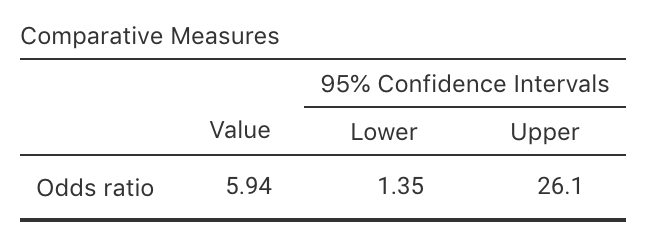
FIGURE 25.2: The jamovi output for computing a CI
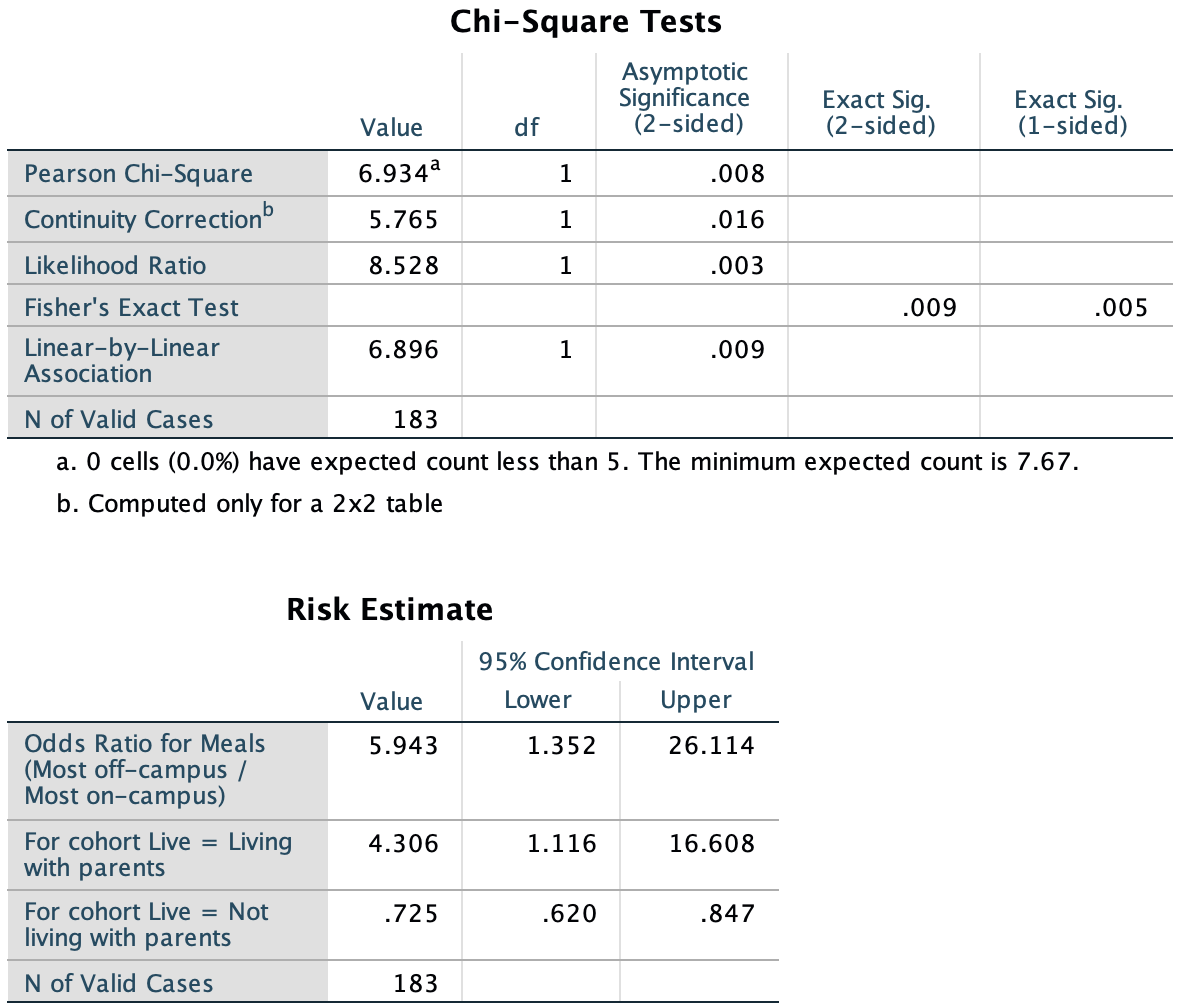
FIGURE 25.3: The SPSS output for computing a CI
Recall that jamovi and SPSS compute the odds ratio as either
- ‘Row 1 to Row 2, comparing Column 1 to Column 2,’ or
- ‘Column 1 to Column 2, comparing Row 1 to Row 2.’
We write:
Based on the sample, a 95% CI for the OR comparing the odds of eating most meals off-campus is from 1.35 to 26.1 (living with parents, compared to not living with parents).
This means there is a 95% chance that this CI straddles the population OR.
Notice that the meaning of the OR is explained in the conclusions: the odds of eating most meals off-campus, and comparing students living with parents to not living with parents.
The CI for an OR is not symmetrical, like the others we have seen10.
This is because the OR has no upper limit, but the lower limit is zero. (The logarithm of the limits of the CI form a symmetric interval.)↩︎