13.1 Introduction
In the last chapter (Sect. 12.10), this RQ was posed:
Among Americans, is the average direct HDL cholesterol different for current smokers and non-smokers?
Graphs were used to understand the data in Sect. 12.10, where information contained in the graphs was given. In some cases, the features of the data displayed in the graph can be described numerically. That is the purpose of this chapter: to learn how to summarise quantitative data numerically.

Example 13.1 (Describing quantitative data) For the RQ above, understanding the response variable (direct HDL cholesterol values) is important; a histogram is useful (Fig. 13.1).
What does the histogram tell us?
- Average: The average value is about 1.5 mmol/L.
- Variation: The values range from about 0.5 to 3 mmol/L, but with some larger values (that are hard to see on the histogram).
- Shape: The distribution is slightly skewed right.
- Outliers: Some large outliers are present (that are hard to see on the histogram).
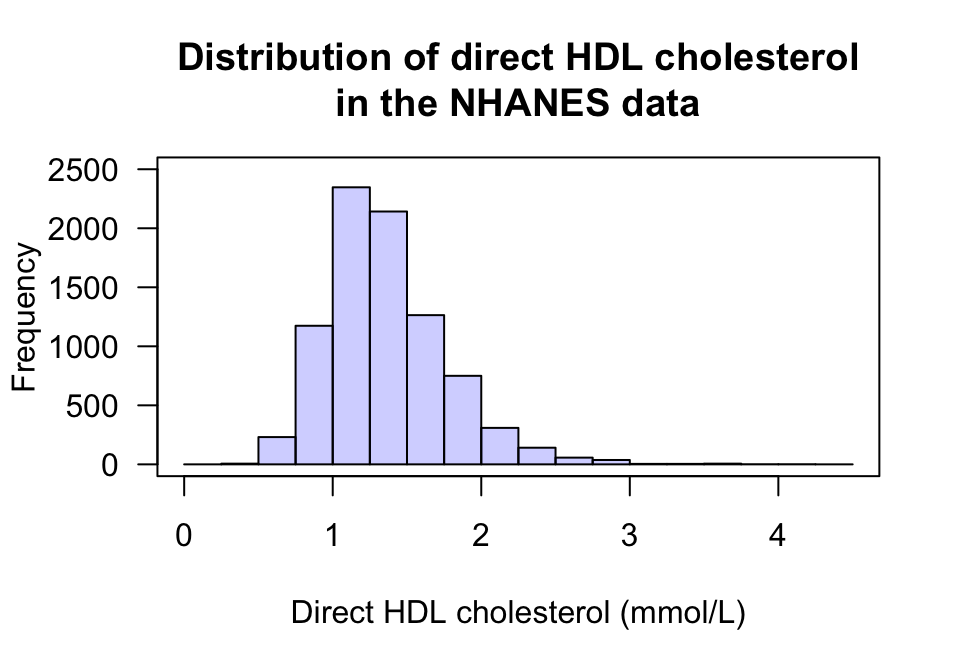
FIGURE 13.1: The histogram of the direct HDL cholesterol from the NHANES study
A number that describes a feature of a population is called a parameter. The values of parameters are usually unknown.
In contrast, a number that describes a feature of a sample is called a statistic. That is:
- Samples are numerically described by statistics;
- Populations are numerically described by parameters.