24.10 Example: Health Promotion services
A study (Becker et al. 1991) compared the access to health promotion (HP) services for people with and without a disability.
Access was measured using the quantitative Barriers to Health Promoting Activities for Disabled Persons (BHADP) scale. Higher scores mean greater barriers to health promotion services.
The RQ is:
What is the difference between the mean BHADP scores, for people with and without a disability?
The parameter is \(\mu_D - \mu_{ND}\), the difference between the two population means (disability, minus non-disability).
In this case, only summary data is available (Table 24.3): the data is not available. Nonetheless, a useful graphical summary (an error bar chart) can be produced by computing the CI for each group manually (Fig. 24.11).
The best estimate of the difference between the population means is the difference between sample means: \((\bar{x}_D - \bar{x}_{ND}) = 6.76\). The standard error for estimating this difference is \(\text{s.e.}(\bar{x}_D - \bar{x}_{ND}) = 0.80285\), as given in the table.
| Sample mean | Std deviation | Sampe size | Std error | |
|---|---|---|---|---|
| Disability | 31.83 | 7.73 | 132 | 0.6728 |
| No disability | 25.07 | 4.8 | 137 | 0.4101 |
| Difference | 6.76 | 0.80285 |
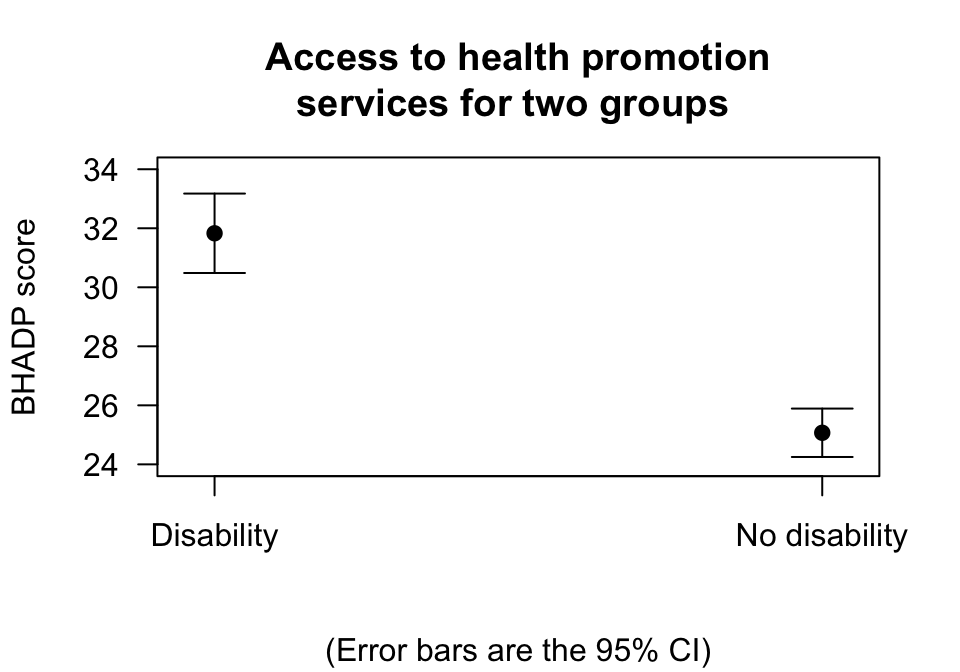
FIGURE 24.11: Error bar chart showing the mean BHADP score for people with and without a disability, and the 95% CIs
Based on the sample, an approximate 95% CI for the difference in population mean BHADP scores between people with and without a disability is
\[ 6.76 \pm (2 \times 0.80285), \] or from \(5.15\) to \(8.37\), higher for those with a disability.
This means that, if many samples of size 132 and 137 were found, and the difference between the mean BHADP scores were found, about 95% of the CIs would contain the population difference (\(\mu_D - \mu_{ND}\)). Loosely speaking, there is a 95% chance that our CI straddles the difference in the population means (\(\mu_D - \mu_{ND}\)).
Using the validity conditions, the CI is statistically valid.