17.12 Exercises
Selected answers are available in Sect. D.17.
Exercise 17.1 Consider again the study by Aedo-Ortiz et al. (1997), who studied the diameter of trees in certain forests. The tree diameters can be modelled with
- a normal distribution; with
- a mean of \(\mu=8.8\) inches; and
- a standard deviation of \(\sigma=2.7\) inches.
For these trees:
- What is the probability that a tree will have a diameter less than 8 inches?
- What is the probability that a tree will have a diameter greater than 9 inches?
- What is the probability that a tree will have a diameter between 7 and 10 inches?
- The largest 15% of trees have what diameters?
- The smallest 25% of trees have what diameters?
Exercise 17.2 In a study (Snowden and Basso 2018) to help understand factors influencing preterm births, the researchers modelled the gestation length of healthy babies as having a normal distribution with a mean of 40 weeks, and a standard deviation of 1.64 weeks. Using this model:
- What proportion of births are longer than 39 weeks (that is, nine months)?
- In Australia, a premature birth is defined as a birth occuring before 37 weeks. What proportion of births are expected to be premature?
- According to Health Direct, ‘Babies born between 32 and 37 weeks may need care in a special care nursery.’ What proportion of healthy births would be expected to be born between 32 and 37 weeks gestation?
- How long is the gestation length for the longest 5% of pregnancies?
- How long is the gestation length for the shortest 5% of pregnancies?
Exercise 17.3 IQ scores are designed to have a mean of 100 and a standard deviation of 15. Mensa is a society for people with a high IQ:
What IQ score is needed to join Mensa?Membership of Mensa is open to persons who have attained a score within the upper two percent of the general population on an approved intelligence test that has been properly administered and supervised.
Exercise 17.4 IQ scores are designed to have a mean of 100 and a standard deviation of 15. Zagorsky (2016) reports that
What IQs scores lead to a rejection from the US military?…Congress requires the Pentagon to reject all military recruits whose IQ is in the bottom 10% of the population…
Exercise 17.5 IQ scores are designed to have a mean of 100 and a standard deviation of 15. Match the diagram in Fig. 17.14 with the meaning.
- IQs greater than 110.
- IQs between 90 and 115.
- IQs less than 110.
- IQs greater than 85.
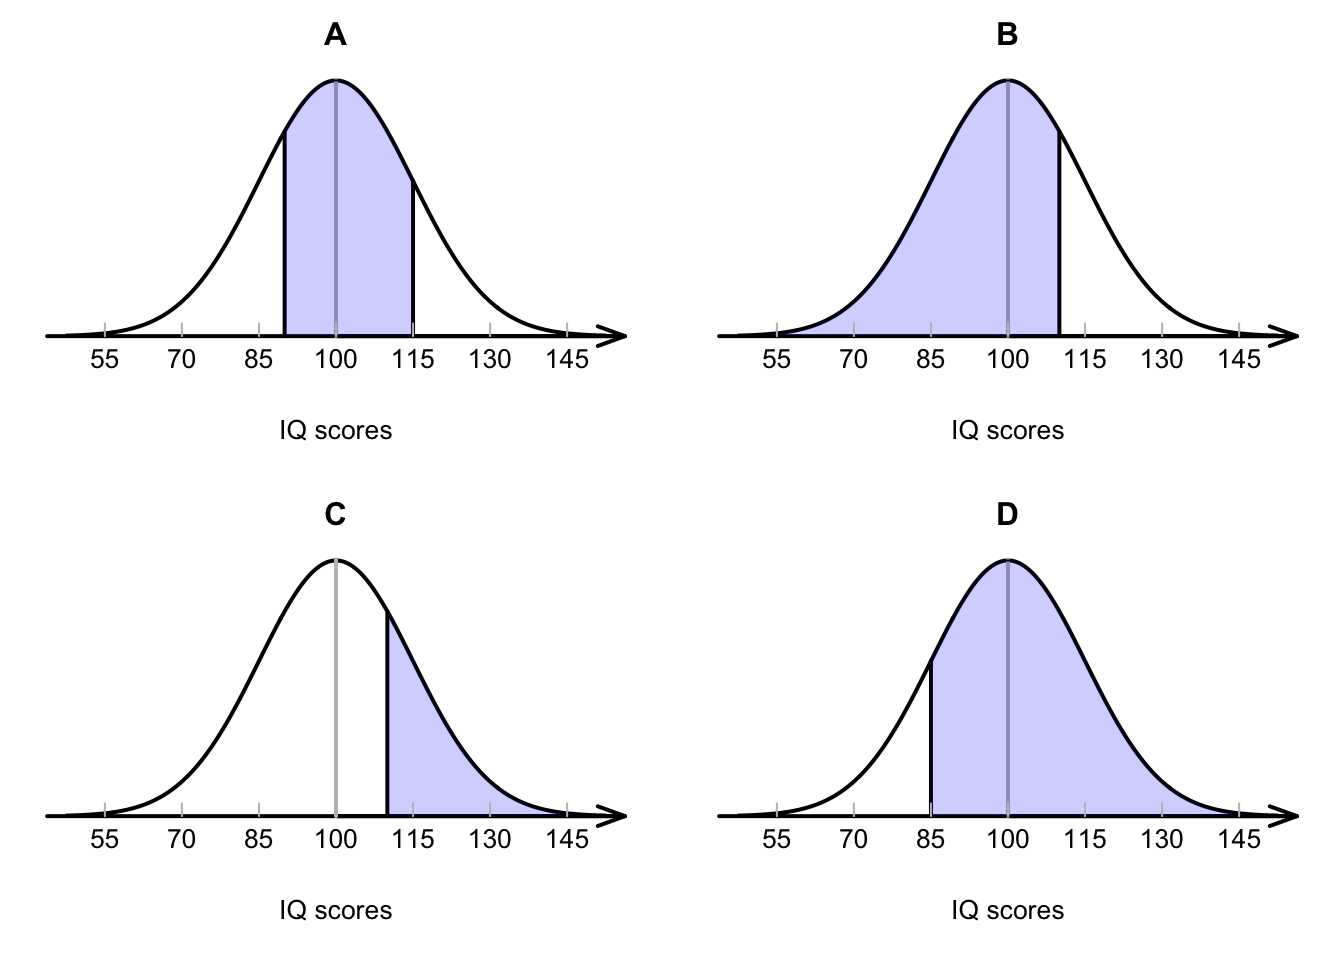
FIGURE 17.14: Match the diagram with the description
Exercise 17.6 IQ scores are designed to have a mean of 100 and a standard deviation of 15. Match the diagram in Fig. 17.14 with the meaning.
- The largest 25% of IQ scores.
- The smallest 10% of IQ scores.
- The largest 70% of IQ scores.
- The smallest 60% of IQ scores.
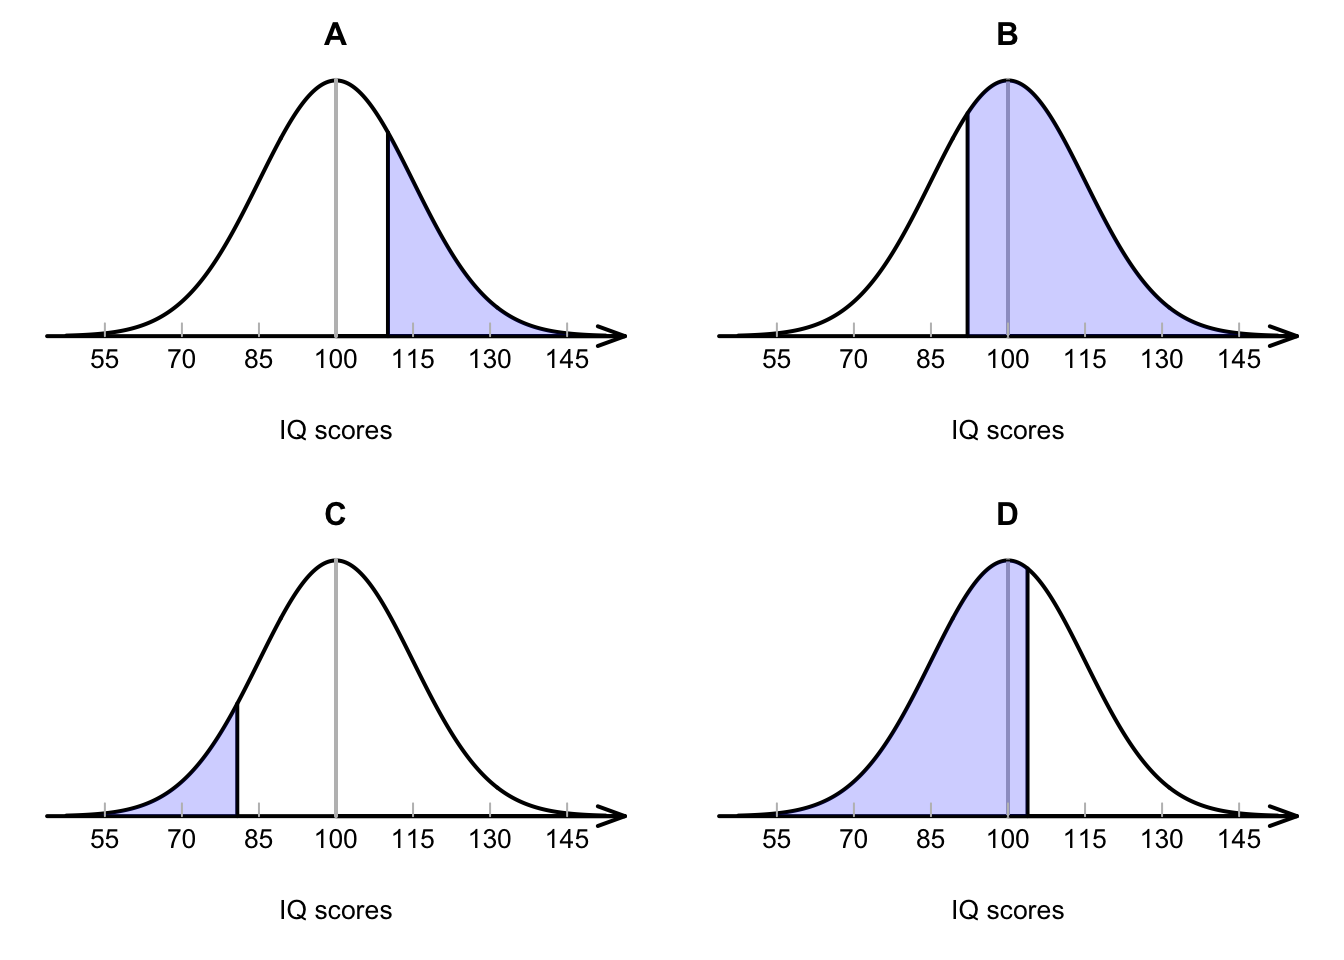
FIGURE 17.15: Match the diagram with the description
Exercise 17.7 A study of the impact of charging electric vehicles (EVs) on electricity demands (Affonso and Kezunovic 2018) modelled the time at which people began charging their EVs at home. Based on a survey (US Department of Transportation 2011), they modelled the time at which EVs began charging as having a mean of 5:30pm, with a standard deviation of 2.28 hrs. For this model:
- What is the probability that an EVs will begin charging after 9pm?
- What is the probability that an EVs will begin charging before 5pm?
- What is the probability that an EVs will begin charging between 5pm and 6pm?
- 30% of the EVs begin charging after what time?
- The earliest 15% of charging begins when?