24.4 Numerical summary
The numerical summary should summarise both groups, but must summarise the differences between the means (since the RQ is about this difference). All this information can be found using jamovi (Fig. 24.2) or SPSS (Fig. 24.3), then compiled into a table (Table 24.2).
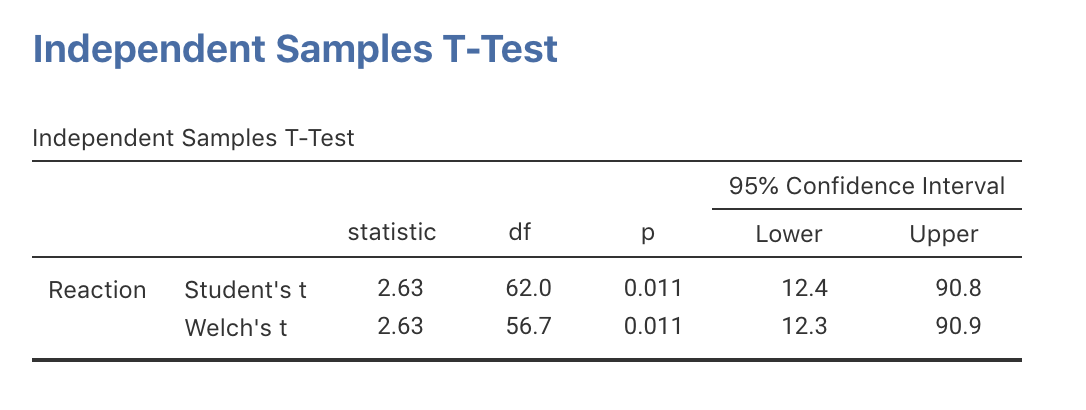
FIGURE 24.2: jamovi output for the phone reaction time data
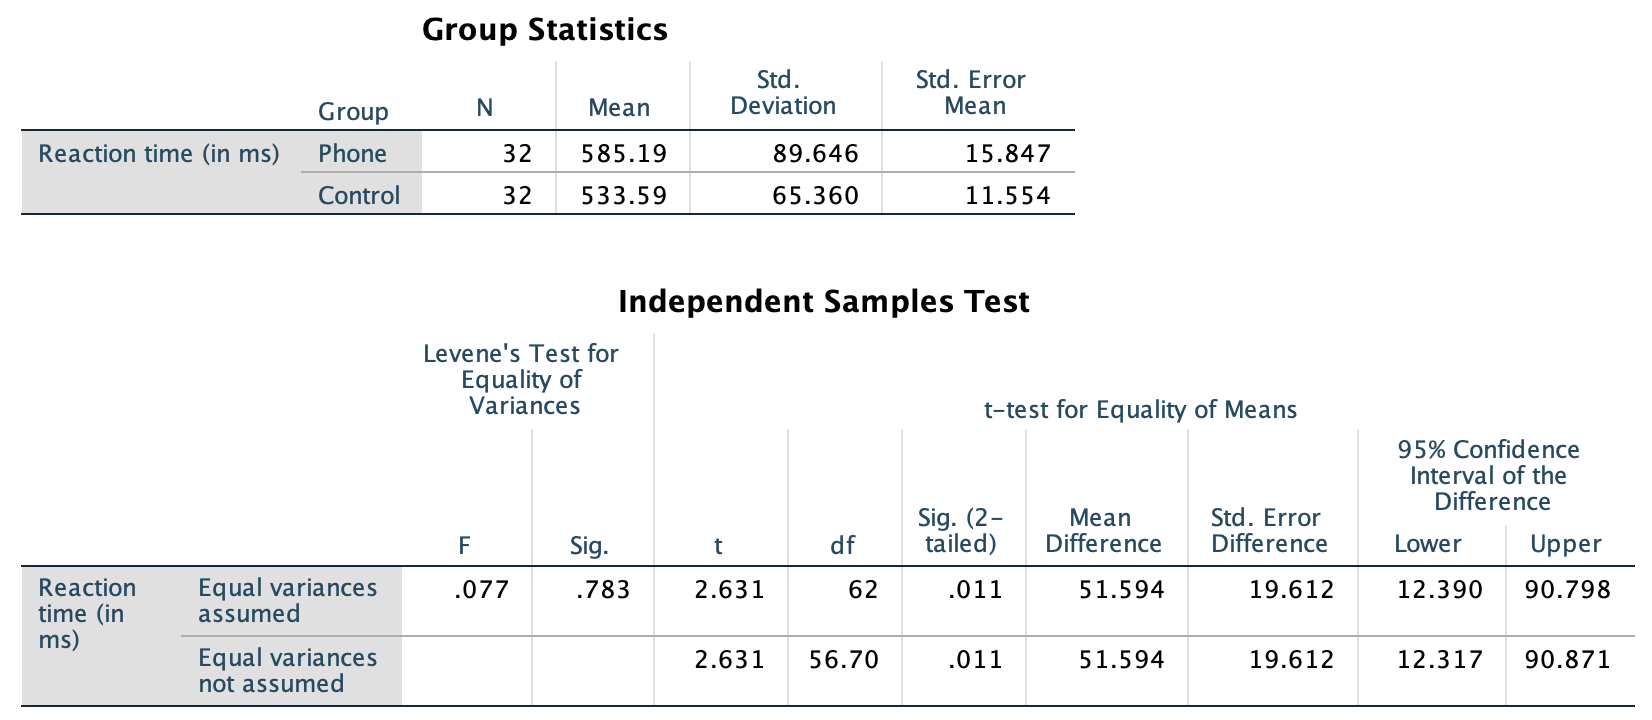
FIGURE 24.3: SPSS output for the phone reaction time data
| Mean | Sample size | Std dev | Standard error | |
|---|---|---|---|---|
| Using phone | 585.19 | 32 | 89.65 | 15.847 |
| Not using phone | 533.59 | 32 | 65.36 | 11.554 |
| Difference | 51.59 | 19.612 |
Each time the study is repeated, the means for each group are likely to be different, and so the difference between the means is likely to be different. That is, the difference between the means has sampling variation and hence a standard error, since it varies from sample to sample.
Think 24.2 (Standard deviation and standard error) For those using a phone,
what is the difference between the standard deviation and the standard error
in the context of the reaction-time study?
Standard deviation: how much the individual reactions times vary from person to person.
Standard error: how much the difference between sample mean reaction times varies from sample to sample.