5.9 Representative sampling
Obtaining a truly random sample is usually hard or impossible, and the best we can do is to select a sample that we hope is representative of the population. Even so, the results from any non-random sample may not generalise to the intended population. The results will generalise to the population which the sample does represents.
Ideally, even if obtaining a random sample is impossible, prefer a sample where those in the sample are not likely to be different than those not in the sample, at least for the variables of interest.
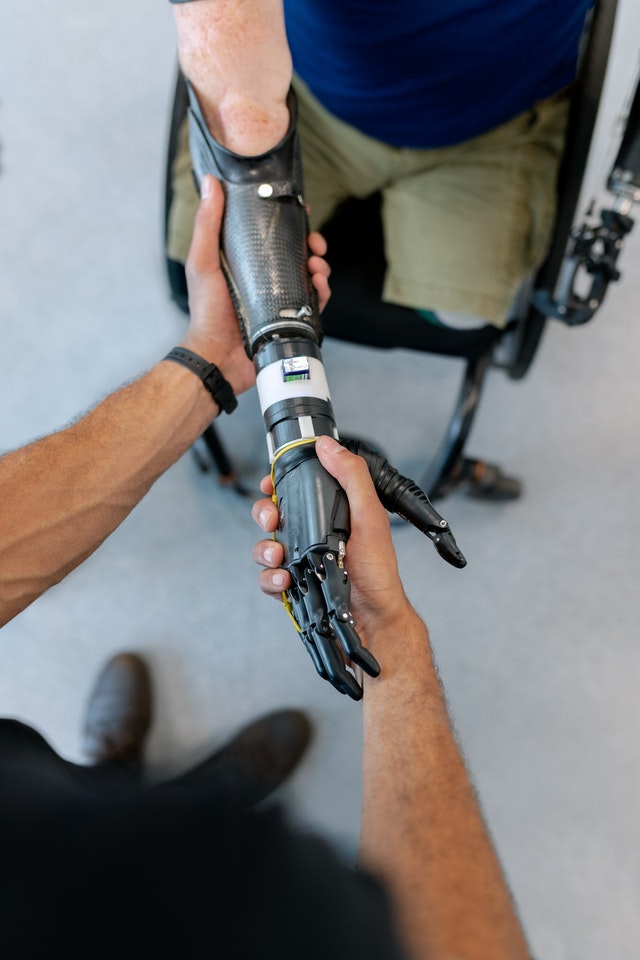
Example 5.7 (Representative sample) A randomly-chosen group of Queensland and Northern Territory residents is asked to evaluate two types of hand prosthetics.
It is probable (but not certain) that their views would be similar to those all of Australians. There is no obvious reason why residents of Queensland and the Northern Territory would be very different from residents in the rest of Australia, regarding their view of hand prosthetics.
Even though the sample is not a random sample of all Australians, the results may generalise to all Australians (though we cannot be sure).
Example 5.8 (Non-representative samples) Suppose we wish to determine the average time per day that Australia households use their air-conditioners for cooling in summer.
If a group of Queensland and Northern Territory residents is asked, this sample would not be expected to represent all Australians: it would over-represent the average number of hours air-conditioners are used for cooling in summer.
In this case, those in the sample are likely to be very different to those not in the sample, regarding their air-conditioners usage for cooling in winter.
In contrast, suppose a group of Tasmanians was asked the same question. This second sample would not be expected to represent all Australians either (it would under-represent).
Again, those in the sample are likely to be very different to those not in the sample, regarding their air-conditioners usage for cooling in winter.Sometimes, a combination of different sampling methods is used.
In a study of diets of children at child-care centres, researchers used samples in 2010 and 2016, described as follows:
In 2010, a stratified random sampling procedure was used to select representative cross-sections of providers working in licensed center-based programs and licensed providers of family home-based care from publically available lists. […] Additional participants were also recruited in 2016 using a combination of stratified random and open, convenience-based sampling.
— Larson et al. (2019), p. 336
Sometimes, practicalities override how the sample can be obtained, which may not result in a random sample. Even so, the impact of this on the conclusions shoud be noted (that is, in discussing the limitations of the study). Sometimes, ways exist to obtain a sample that is more likely to be representative.
Random samples are often difficult to obtain, and sometimes representative samples are the best that can be done.
In a good representative sample, those in the sample are not obviously different than those not in the sample. Try to ensure a broad cross-section of the target population appears in the sample.
Example 5.10 (Attempts to increase representativeness) To find a sample of USC students at Sippy Downs, students at Cafe C could be approached every Monday morning at 8am, for four consecutive weeks.
This is a convenience sample, and not a random sample. However, the sample would be more likely to be representative if a broader cross-section of students was approached:
- Students at Cafe C on Monday at 8am;
- Students at the Brasserie on Tuesday at 11:30am; and
- Students entering the library on Thursdays at 2pm.
This is still not a random sample, but the sample now comprises more than just students who attend university on Mondays at 8am, at Cafe C.
Ideally, student would not be included more than once in our sample, though this is difficult to ensure.Think 5.3 (Sampling) To assess the quality of bearings from a manufacturer, a researcher takes a random sample of 25 bearings from each of the three cases delivered.
What type of sampling scheme is being used?Sometimes, information may be recorded from those in the sample, and this information used this to make some comment about whether our sample seems reasonably representative.
For example, the sex and age of a sample of USC students may be recorded; if the proportion of females in the sample, and the average age of students in the sample, are similar to those of the whole USC population, then the sample may be somewhat representative of the population. (though we cannot be sure).

Example 5.11 (Comparing samples and populations) A study of the adoption of electric vehicles (EVs) by Americans (Egbue et al. 2017) used a sample of \(n=121\) found through social media (such as Facebook) and professional engineering channels. This is not a random sample.
The authors compared some characteristics of the sample with the American population from the 2010 census (Table 5.3), stating:
The sample has a higher representation of males and individuals in the 18–44 age group […] compared to the US population. In addition, the sample has a higher representation of […] wealthier individuals.
— Egbue et al. (2017), p. 1931
In interpreting the results of this study, the authors say:
…the results of this study are more applicable to people with an engineering or technical background…
— Egbue et al. (2017), p. 1931
| Sample | Population | |
|---|---|---|
| Gender | ||
| Male | 77.68 | 49.20 |
| Female | 22.32 | 50.80 |
| Age | ||
| Under 18 | 0.00 | 24.00 |
| 18–44 | 55.36 | 36.50 |
| 45–64 | 31.25 | 26.40 |
| 65 and older | 13.39 | 13.00 |
| Annual income | ||
| Under $75,000 | 28.56 | 67.49 |
| $75,000 and over | 51.78 | 22.51 |
| Prefer not to say | 19.64 | 0.00 |