29.8 Example: Blood pressure

A US study (Schorling et al. 1997; Willems et al. 1997) was conducted to determine how CHD risk factors were assessed among parts of the population. Subjects were required to report to the clinic on multiple occasions.
One RQ of interest is:
Is there a mean difference in blood pressure measurements between the first and second visits?
The parameter is \(\mu_d\), the population mean reduction in blood pressure.
Each person has a pair of diastolic blood pressure (DBP) measurements: One each from their first and second visits. The data shown below, are from 141 people. These data were shown in Sect. 23.10. The differences could be computed in one of two ways:
- The observation from the first visit, minus the observation from the second visit: the reduction in BP; or
- The observation from the second visit, minus the observation from the first visit: the increase in BP.
Either way is fine, as long as the order remains consistent, and the direction is made clear. Here, the observations from the first visit minus the observation from the second visit will be used, so that the differences represent the decrease in BP from the first to second measurement.
The appropriate graphical summary is a histogram of differences (Fig. 23.4); the numerical summary is shown in Table 29.1. Notice that having the information about the differences is essential, as the RQ is about the differences.
| Mean | Standard deviation | Standard error | Sample size | |
|---|---|---|---|---|
| DBP: First visit | 94.48 | 11.473 | 0.966 | 141 |
| DBP: Second visit | 92.52 | 11.555 | 0.973 | 141 |
| Decrease in DBP | 1.95 | 8.026 | 0.676 | 141 |
As always (Sect. 28.2), the null hypothesis is the ‘no difference, no change, no relationship’ position, proposing that the mean difference in the population is non-zero due to sampling variation:
- \(H_0\): \(\mu_d=0\) (differences: \(\text{first} - \text{second}\));
- \(H_1\): \(\mu_d \ne 0\).
The alternative hypothesis is two-tailed because of the wording of the RQ. As usual, assume that \(H_0\) is true, and then the evidence is evaluated to determine if it contradicts this assertion.
The sampling distribution describes how the sample mean difference is expected to vary from sample to sample due to sampling variation, when \(\mu_d=0\). Under certain circumstances, the sample mean differences are likely to vary with a normal distribution, with a mean of 0 (from \(H_0\)) and a standard deviation of \(\text{s.e.}(\bar{d}) = 0.676\).
The relative value of the observed sample statistic is found by computing a \(t\)-score, using software (jamovi: Fig. 29.6; SPSS: Fig. 29.7), or manually (Eq. (27.1), using the information in Table 29.1):
\[\begin{align*} t &= \frac{\text{sample statistic} - \text{assumed population parameter}} {\text{standard error of the statistic}}\\ &= \frac{1.950 - 0}{0.676} = 2.885. \end{align*}\] Either way, the \(t\)-score is the same.
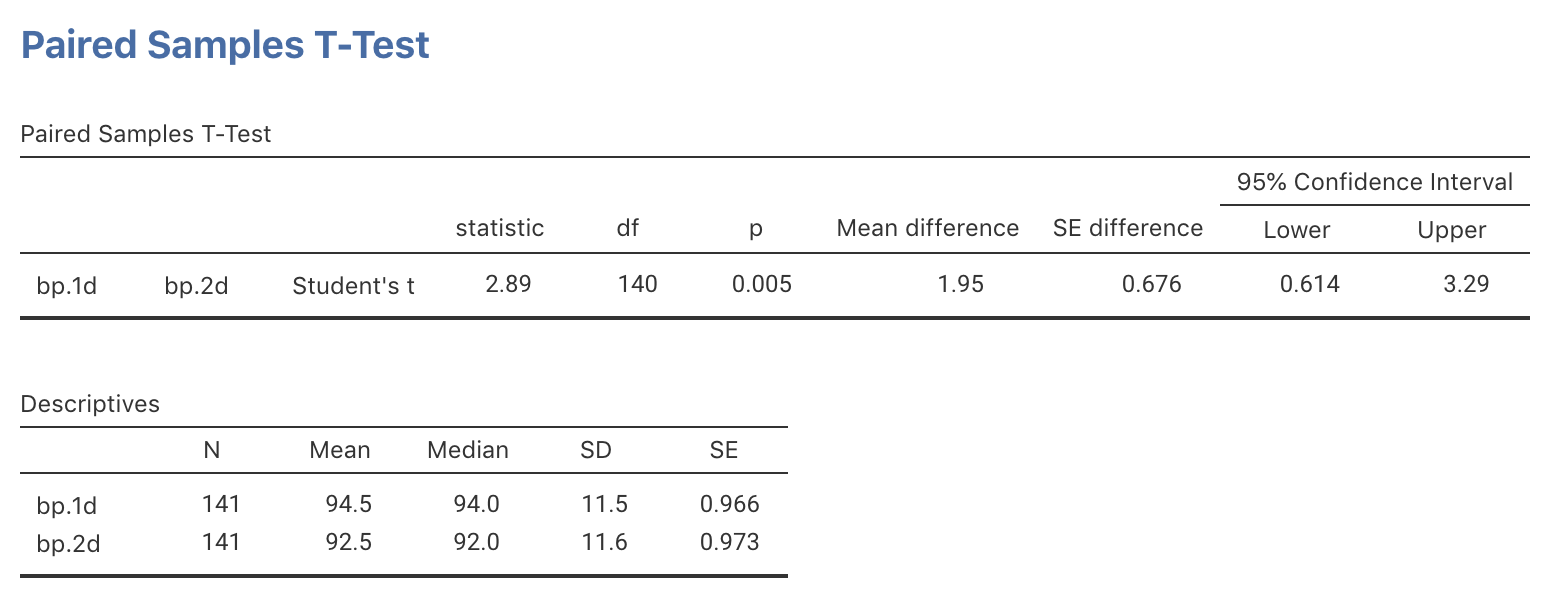
FIGURE 29.6: jamovi output for the diabetes data
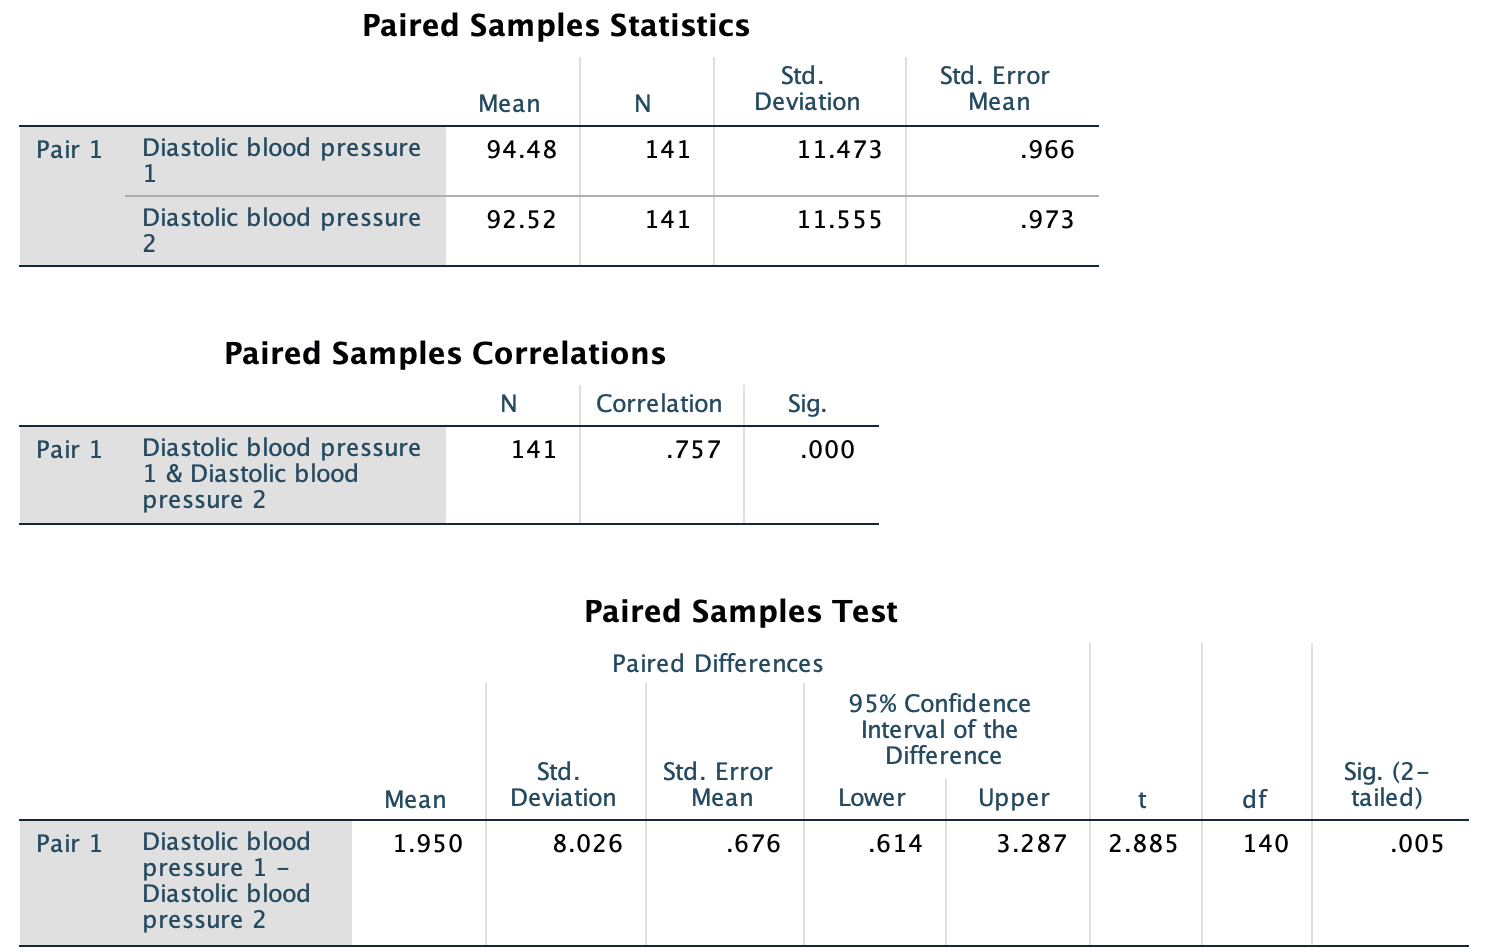
FIGURE 29.7: SPSS output for the diabetes data
A \(P\)-value is then needed to decide if the sample is consistent with the assumption. Using the 68–95–99.7 rule, the approximate two-tailed \(P\)-value is much smaller than 0.05. Alternatively, the software output (Fig. 29.6; Fig. 29.7) reports the two-tailed \(P\)-value as \(P=0.005\).
We conclude:
Strong evidence exists in the sample (paired \(t=2.855\); two-tailed \(P=0.005\)) of a population mean difference between the first and second DBP readings (mean difference \(1.95\) mm Hg higher for first reading; 95% CI from \(0.61\) to \(3.3\) mm Hg; \(n=141\)).
Since \(n>25\), the results are statistically valid.