30.12 Exercises
Selected answers are available in Sect. D.28.
Exercise 30.1 Earlier, the NHANES study (Sect. 12.10; Exercise 24.1), was used to address this RQ:
Use the SPSS output in Fig. 30.5 to perform a hypothesis test to answer the RQ.Among Americans, is the mean direct HDL cholesterol different for current smokers and non-smokers?
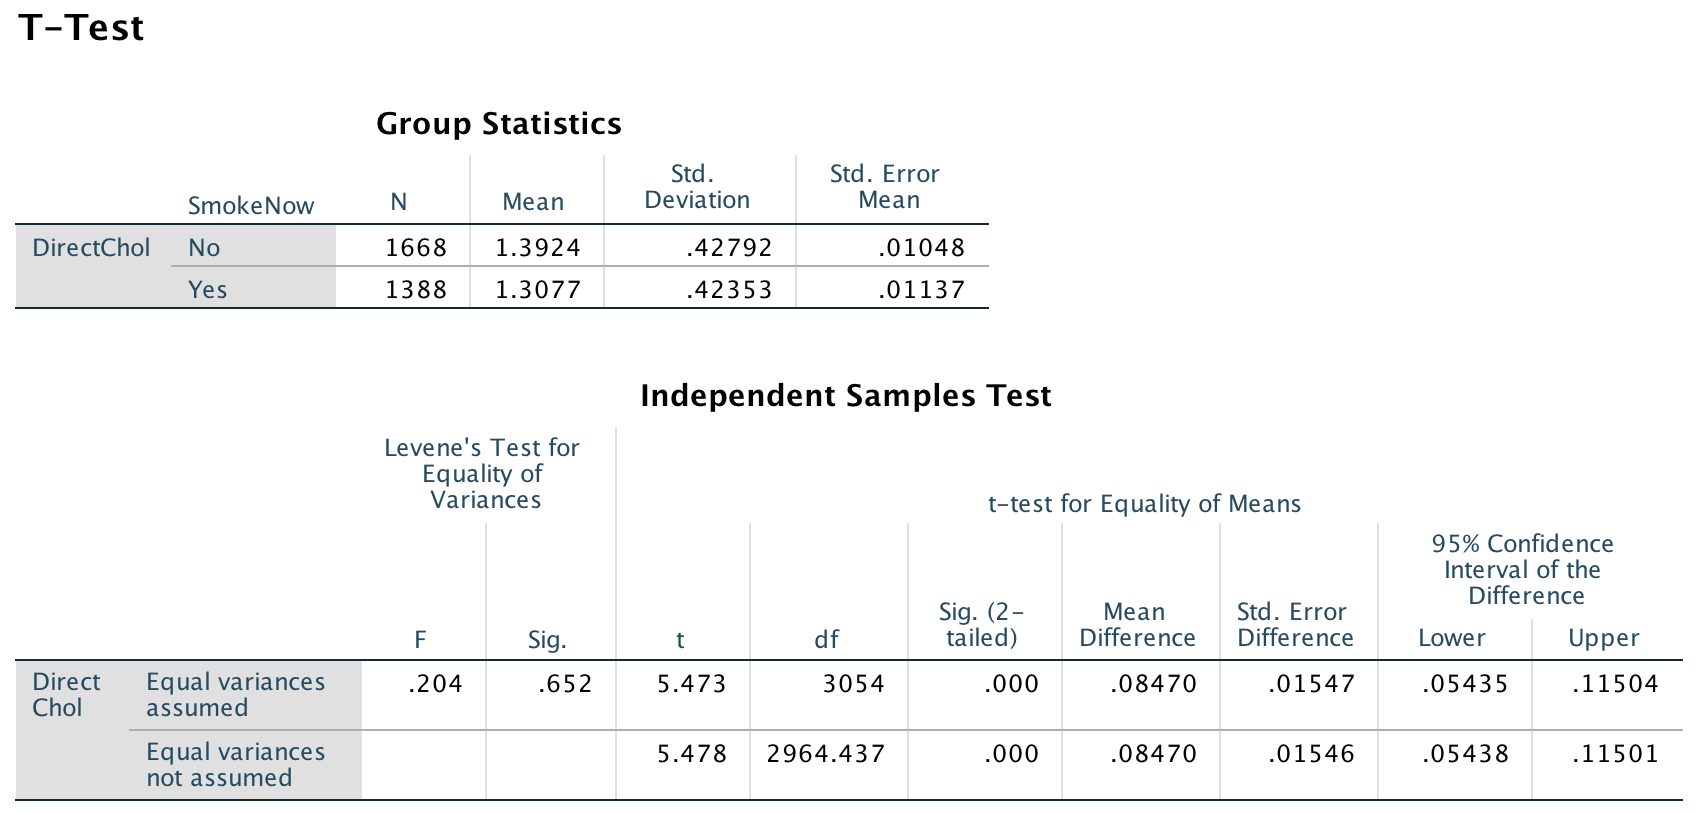
FIGURE 30.5: SPSS output for the NHANES data
Exercise 30.2 A study of male paramedics in Western Australia compared conventional paramedics with special operations paramedics (Chapman et al. 2007). Some information comparing their physical profiles is shown in Table 30.5.
- Compute the missing standard errors.
- Consider comparing the mean grip strength for the two groups of paramedics.
The standard error for the difference between the means is 3.3044.
- Carefully write down the hypotheses.
- Compute the \(t\)-score for testing if a difference exists between the two types of paramedics.
- Approximate the \(P\)-value using the 68–95–99.7 rule.
- Discuss the conditions required for statistical validity in this context.
- Make a conclusion.
- Consider comparing the mean number of push-ups completed in one minute.
The standard error for the difference between the means is 4.0689.
- Carefully write down the hypotheses.
- Compute the \(t\)-score for testing if a difference exists between the two types of paramedics.
- Approximate the \(P\)-value using the 68–95–99.7 rule.
- Discuss the conditions required for statistical validity in this context.
- Make a conclusion.
| Conventional | Special Operations | |
|---|---|---|
| Grip strength (in kg) | ||
| Mean | 51 | 56 |
| Std deviation | 8 | 9 |
| Std error | ||
| Push-ups (per minutes) | ||
| Mean | 36 | 47 |
| Std deviation | 10 | 11 |
| Std error | ||
Exercise 30.3 Consider again the body temperature data from Sect. 27.1. The researchers also recorded the gender of the patients, as they also wanted to compare the mean internal body temperatures for males and females.
Use the jamovi output in Fig. 30.6 to perform this test and make a conclusion. Also comment on the practical significance of your results.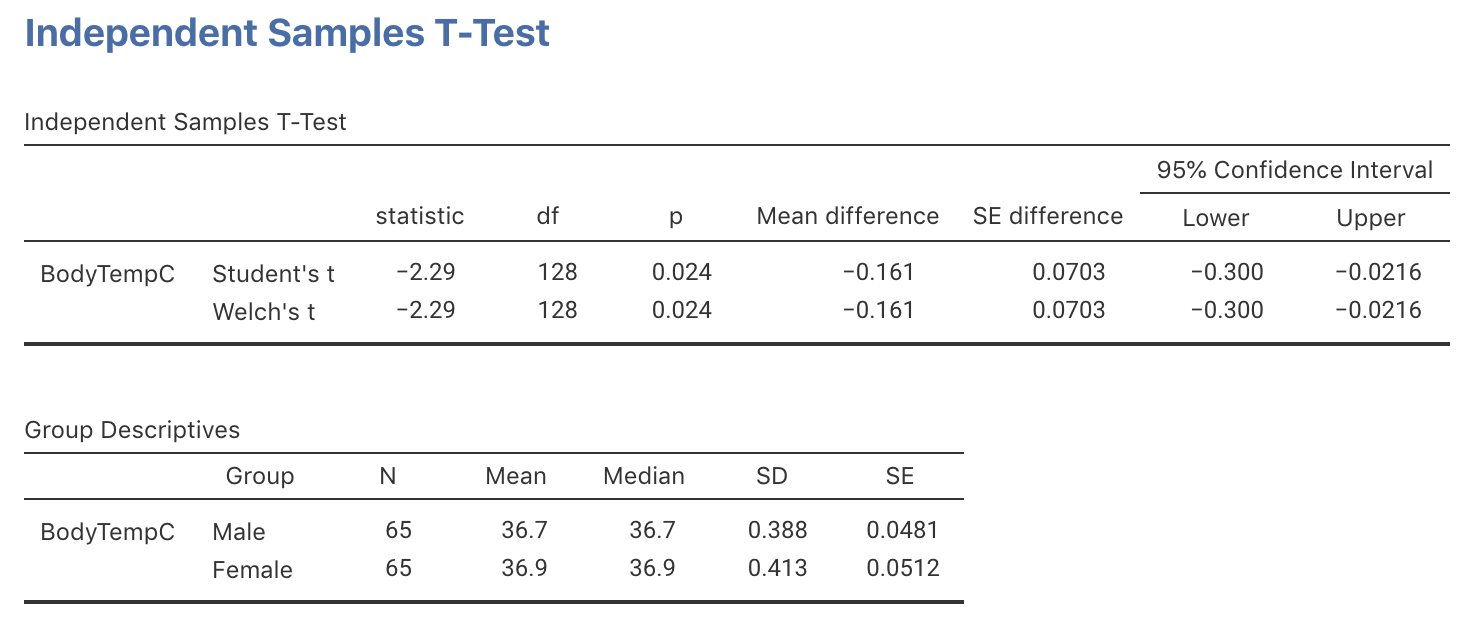
FIGURE 30.6: jamovi output for the body-temperature data
Exercise 30.4 A study (Woodward and Walker 1994) examined the sugar consumption in industrialised (mean: 41.8 kg/person/year) and non-industrialised (mean: 24.6 kg/person/year) countries. The jamovi output is shown in Fig. 30.7.
- Write the hypotheses.
- Write down and interpret the CI.
- Write a conclusion for the hypothesis test.
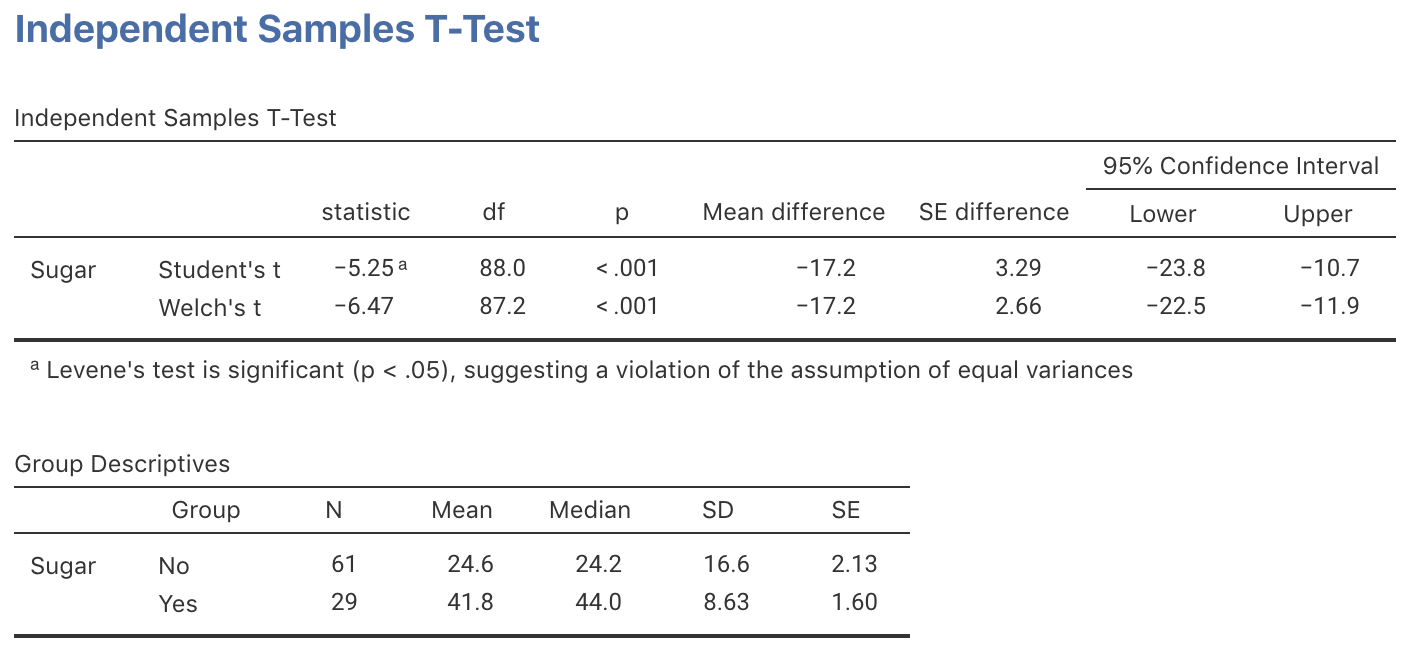
FIGURE 30.7: jamovi output for the sugar-consumption data
In the image below, click on the location where the correct \(P\)-value is located.