18.3 Sample means have a distribution
As with any sample statistic, the sample mean varies from sample to sample (Sect. 15.4) just like sample proportions; that is, sampling variation exists, so the sample means have a sampling distribution.

Consider a European roulette wheel again (Sect. 18.2).
Rather than recording the sample proportion of odd-spins, the sample mean of the numbers spun can be recorded. So, for example, if the wheel is spun (say) 15 times, the sample mean of the spins \(\bar{x}\) will vary.
Of course, spinning the wheel 30, 50 or 100 times also shows that the sample mean \(\bar{x}\) can vary too. How much can it vary?
Again, computer simulation can be used to demonstrate what could happen if the wheel was spun 15 times, over and over and over again, and the mean of the spun numbers was recorded for each repetition.
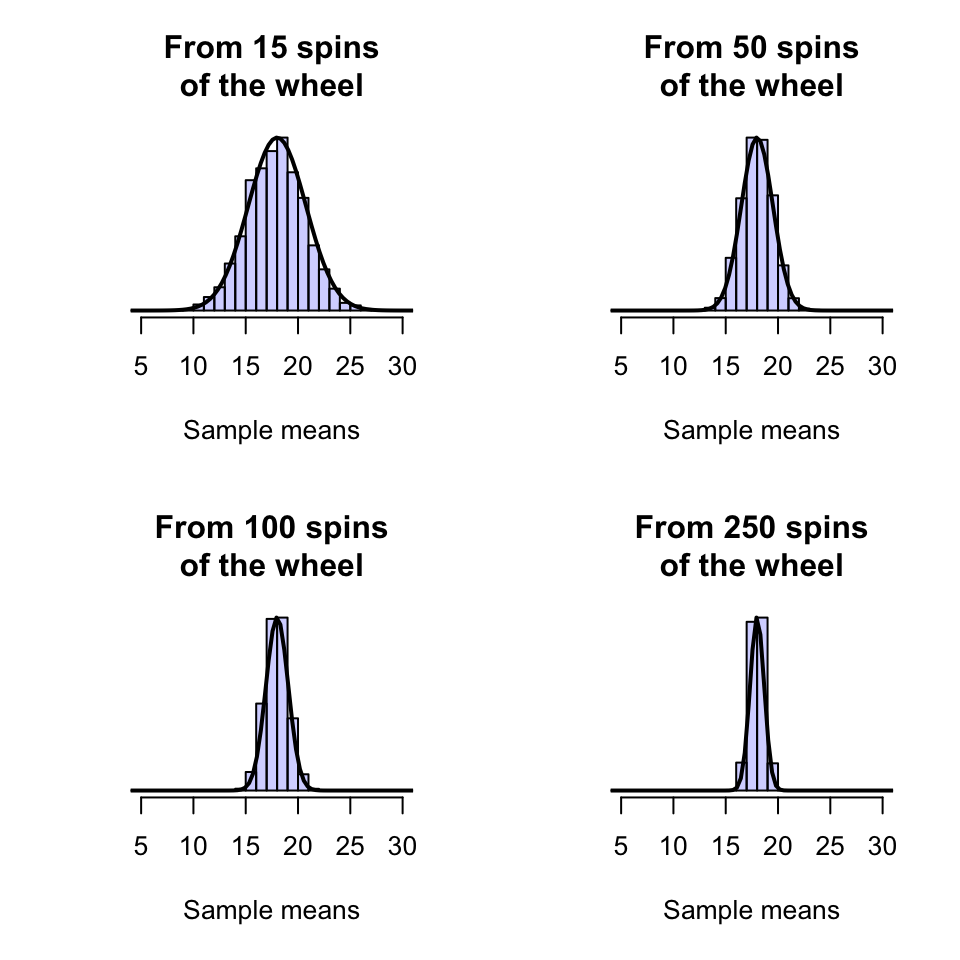
Clearly, the sample mean spin \(\bar{x}\) can vary from sample to sample (sampling variation) for \(n=15\) spins, as shown by a histogram (Fig. 18.2, top left panel).
When \(n=15\), the sample mean \(\bar{x}\) indeed varies from sample to sample, and the distribution of the values of \(\bar{x}\) have an approximate normal distribution. If the wheel was spun more than 15 times (say, \(n=50\) times) something similar occurs (Fig. 18.2, top right panel): the values of \(\bar{x}\) vary from sample to sample, and the values have an approximate normal distribution. In fact, the values of \(\bar{x}\) have a normal distribution for other numbers of spins also (Fig. 18.2, bottom panels).

FIGURE 18.2: Sampling distributions for the mean of the numbers after a roulette wheel spins a certain number of times
The values of the sample mean vary from sample to sample. The distribution of the possible values of a sample statistic, in this case the sample mean, is called a sampling distribution.
Under certain conditions, the sampling distribution of a sample mean is a normal distribution.