37.17 Exercises
Selected answers are available in Sect. D.34. 73
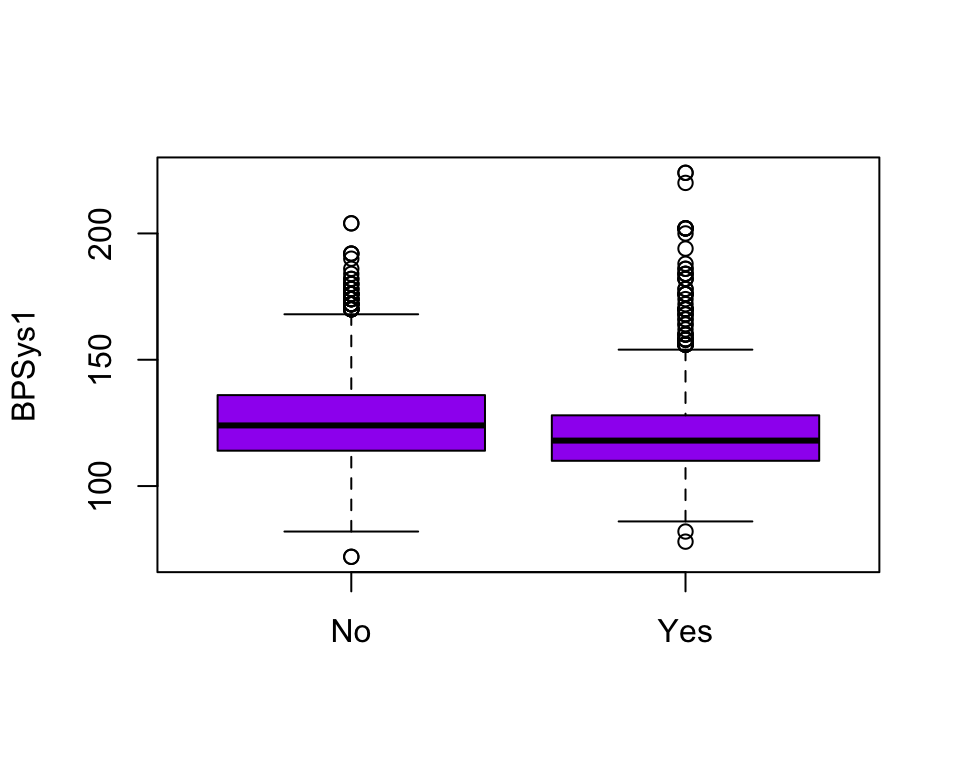
FIGURE 37.2: A boxplot
| Mean | Std dev | |
|---|---|---|
| Current smoker | 206.6 | 46 |
| Current non-smoker | 214.64 | 48.79 |
| Difference | 8.03 | |
| 95% CI | 1.25 | 14.8 |
Exercise 37.2 In a student project, the students recorded the reading speed for students reading a portion of text, and compared the reading speed for two different fonts. Their RQ was:
Which font allows USC students to read a pangram the fastest, between a default and what is considered to be a ‘easy to read’ font.
In their Abstract, the conclusion was:
The Georgia font was the fastest to be read and is therefore the faster of the two.
- Explain why this is a poorly-worded RQ. Rewrite the RQ.
- Explain what is wrong with the conclusion given in the Abstract. Rewrite the statement.
| Sample size | Mean | Standard deviation | Standard error | Confidence interval (95%) | t value | P value | |
|---|---|---|---|---|---|---|---|
| 50 | 7.48 | 4.674 | 0.661 | 6.152 to 8.808 | 11.316 | 0 |
Exercise 37.4 In a student project, the aim was ‘to determine if the proportion of males and females that use disposable cups on USC Campus is the same.’ The two variables observed on each person in the study were:
- Whether or not the person used a disposable cup;
- The sex of the person.
In reporting the results in their Abstract, the students state:
Critique this statement.Based on the sample results, the 95% confidence interval for the population mean number of disposable cups used by males and females is between 0.690 and 1.625. Meaning that the population mean is likely to fall between those two intervals.
Exercise 37.5 In a student project, the aim was ‘to determine if the average hang time is different between two types of paper plane designs.’ The two variables in the study were:
- The plane design (Basic Dart; Hunting Flight);
- The hang time of the flight of the plane (in seconds).
In reporting the results in their Abstract, the students state:
Critique this statement.Very strong evidence proving a difference (\(P = .000\)) between the Basic Dart mean hang time (\(881.84\pm 140.73\)ms) and the Hunting Flight mean hang time (\(1504.19\pm 699.86\)ms). 95% CI for the means of The Basic Dart (\(829.29\) – \(934.39\)) and the Hunting Flight (\(1242.86\) – \(1765.52\)).
Exercise 37.6 An article (Baur et al. 2012) includes this in the Abstract:
Cardiovascular disease (CVD) accounts for 45% of on-duty fatalities among firefighters, occurring primarily in firefighters with excess CVD risk factors in patterns resembling the metabolic syndrome (MetSyn). Additionally, firefighters have a high prevalence of obesity and sedentary behavior suggesting that MetSyn is also common. Therefore we assessed the prevalence of MetSyn in firefighters and its association with cardiorespiratory fitness (CRF) in a cross-sectional study of 957 male career firefighters.
— Baur et al. (2012), p. 2331
| OR (95% CI) | \(p\)-value | |
|---|---|---|
| Model 1 | ||
| CRF | 0.691 (0.634–0.752) | <0.0001 |
| Age | 1.037 (1.020–1.055) | <0.0001 |
| Model 2 | ||
| CRF | 0.693 (0.630–0.762) | <0.0001 |
| Age | 1.002 (0.982–1.021) | 0.8713 |
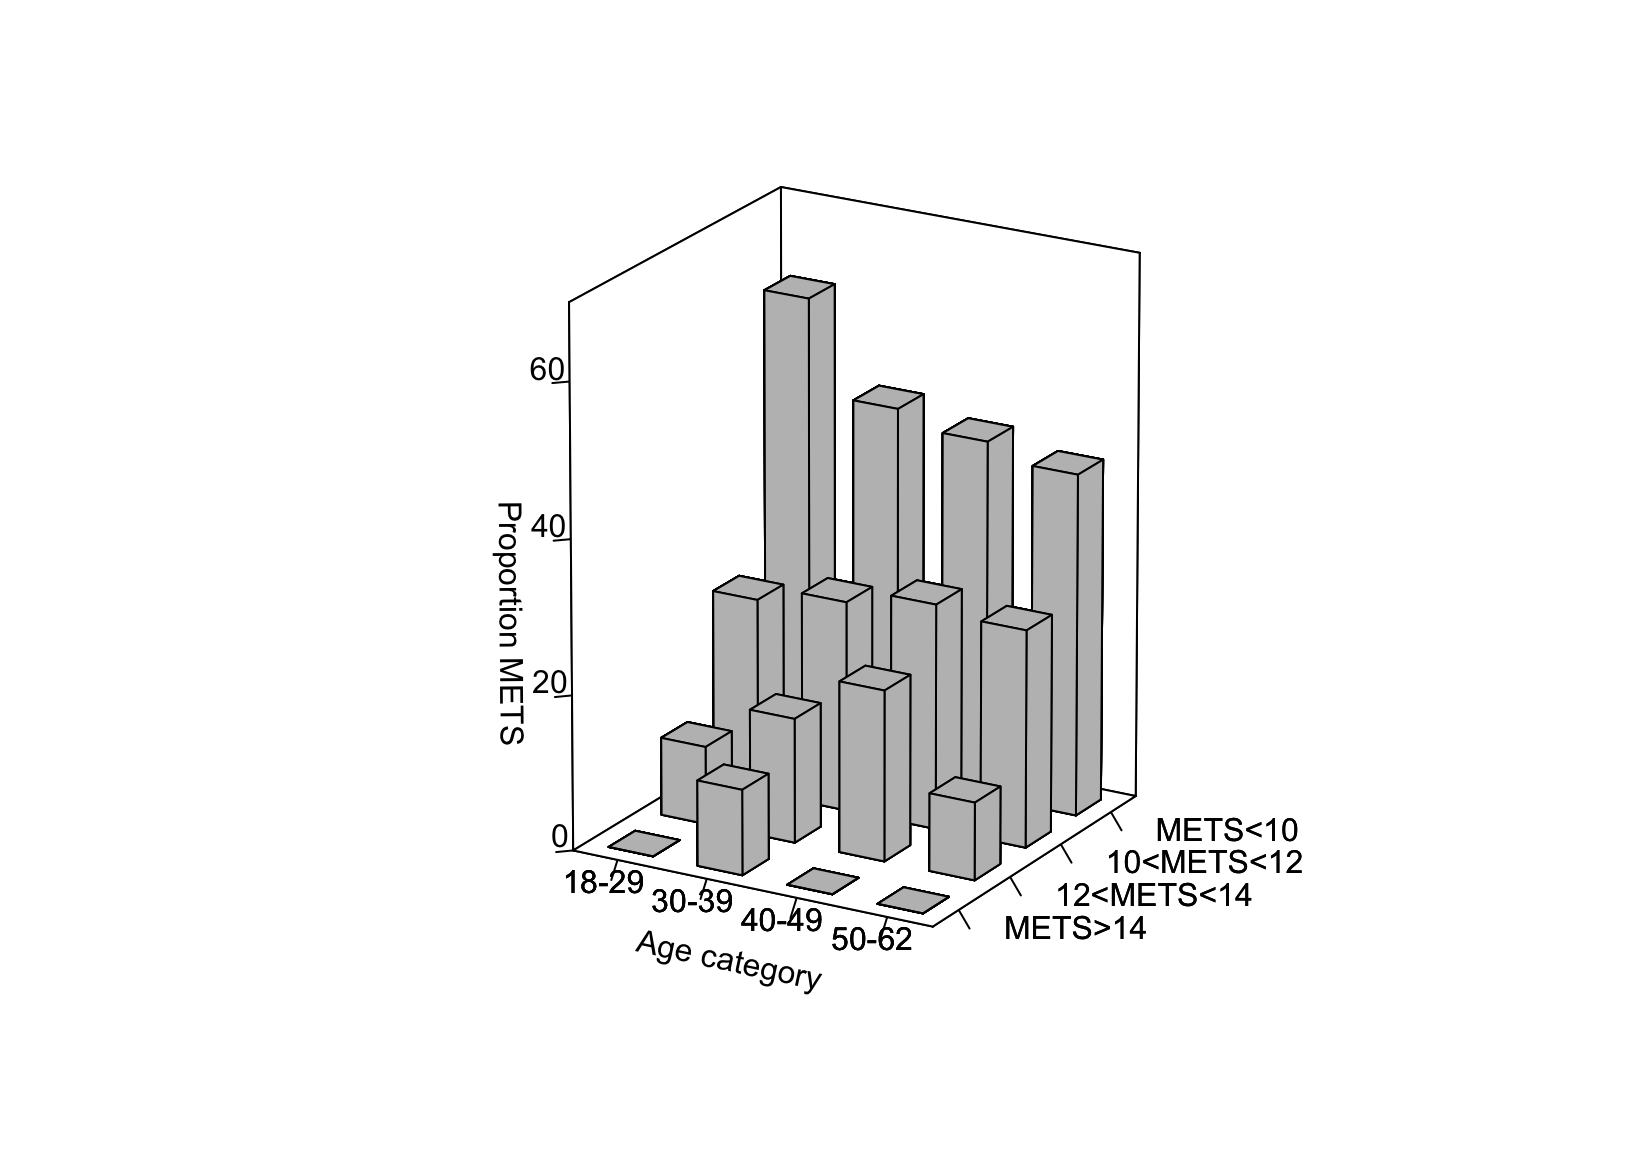
FIGURE 37.3: A graph like that in the Baur et al. paper
Exercise 37.7 A study (Baughman et al. 2007) gave this information:
Critique the graph in Fig. 37.4 which appears in the paper.The aim of our study was to determine the range of 6MWD [6-minute walk distance] in an unselected group of sarcoidosis patients. We performed a prospective study of sarcoidosis patients followed up in one tertiary sarcoidosis clinic.
— Baughman et al. (2007), p. 208
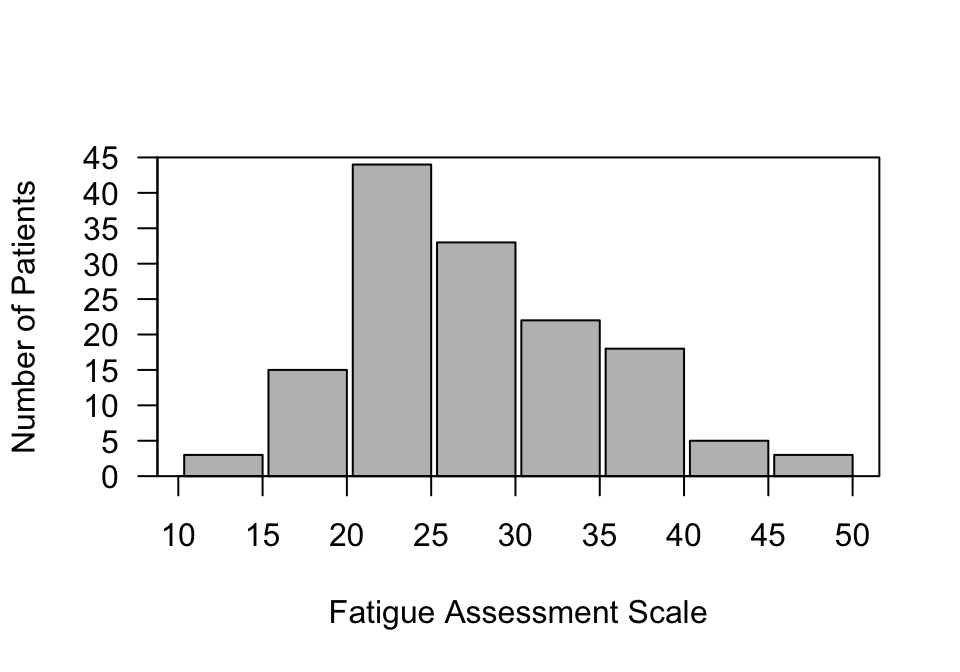
FIGURE 37.4: A graph like that from the Baughman et al. paper