35.11 Quick review questions
A study of athletes (Telford and Cunningham 1991) examined the relationship between the height and weight of \(n=37\) rowers at the Australian Institute of Sport (AIS), as shown in Fig. 35.14.
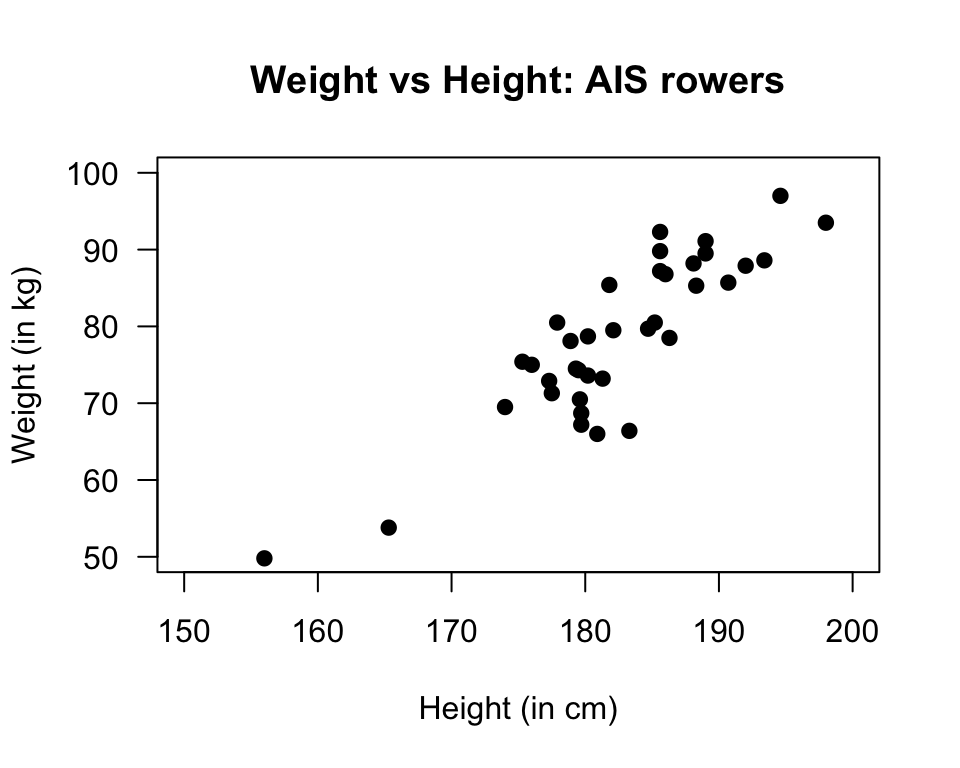
FIGURE 35.14: Scatterplot of Weight against Height rowers at the AIS
- Using the ‘rise over run’ idea, the slope is approximately
- The \(y\)-variable is
- The regression equation is \(\hat{y} = -138 + 1.2 x\).
What does \(x\) represent?
- What does the ‘hat’ above the \(y\) mean?
- To two decimal places, what weight would be predicted for a rower who is 180cm tall?
- The standard error of the slope is 0.112. What is the value of the test statistic
(to one decimal place) to
test if the population slope is zero?
- True or false? The \(P\)-value for this test will be very small
- True or false? The units of the slope are kg/cm
- True or false? Making a prediction for the weight of a
rower weighing 220 kg would be an example of extrapolation
References
Telford RD, Cunningham RB. Sex, sport, and body-size dependency of hematology in highly trained athletes. Medicine and Science in Sports and Exercise. 1991;23(7):788–94.