12 Graphical summaries of data
So far, you have learnt to ask a RQ, identify different ways of obtaining data, design the study, collect the data and describe the data.
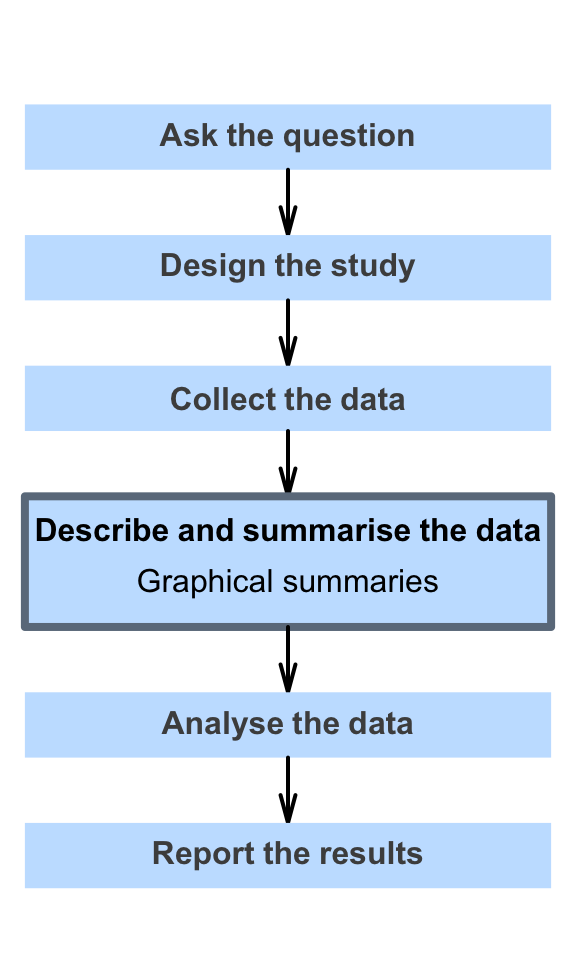
In this chapter, you will learn to graph the data, so we can understand the data used to answer the RQ. You will learn to:
- select the appropriate graphic to graphically summarise data.
- graphically summarise data using quality, appropriate graphs.
- interpret graphs.
- identify badly prepared graphics, giving reasons.