29.5 \(P\)-values: Consistency with assumption?
A \(P\)-value determines if the sample data are consistent with the assumption (Table 28.1), Since \(t=1.681\), the one-tailed \(P\)-value is between 2.5% and 16% based on the 68–95–99.7 rule. This is a wide, and inconclusive, interval. Software gives a more precise \(P\)-value (jamovi: Fig. 29.4; SPSS: Fig. 29.5): the two-tailed \(P\)-value is \(0.127\), so the one-tailed \(P\)-value is \(0.127/2 = 0.0635\).
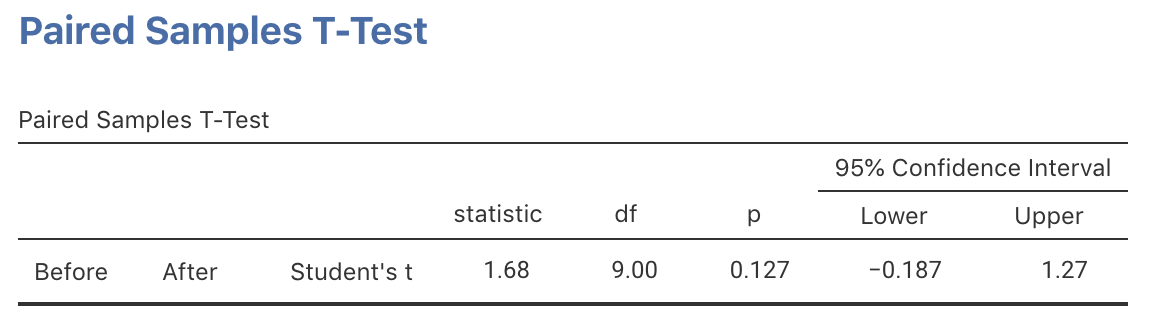
FIGURE 29.4: jamovi output for the insulation data
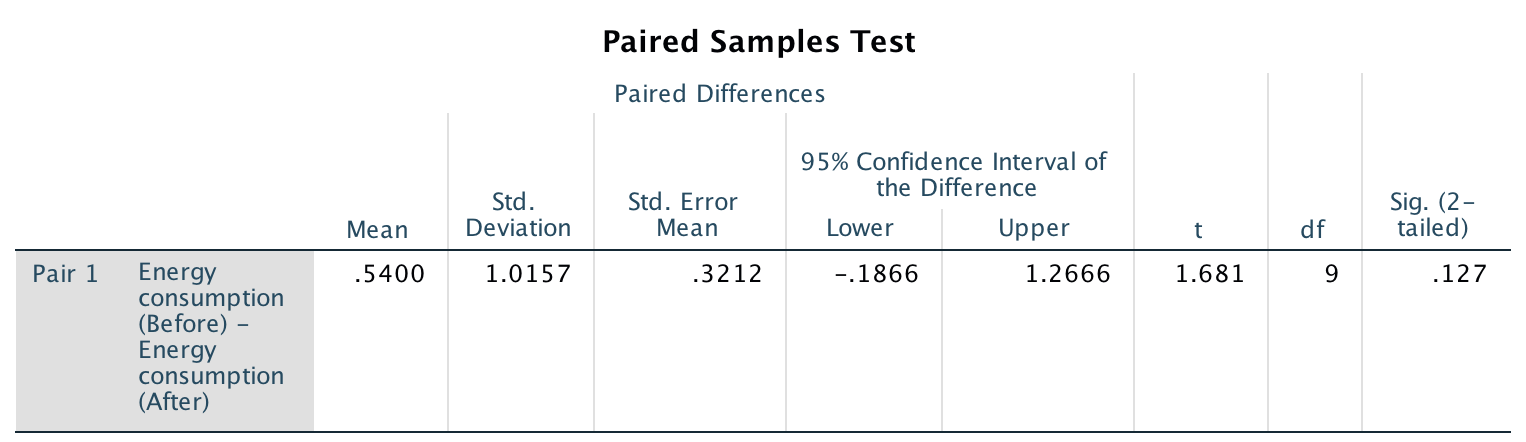
FIGURE 29.5: SPSS output for the insulation data
The software clarifies how the differences have been computed:
Click on the hotspots in the following image, to see how to read the SPSS output.