33.5 Quick review questions
A study of onion growth (Mead 1970) produced the scatterplot shown in Fig. 33.5.
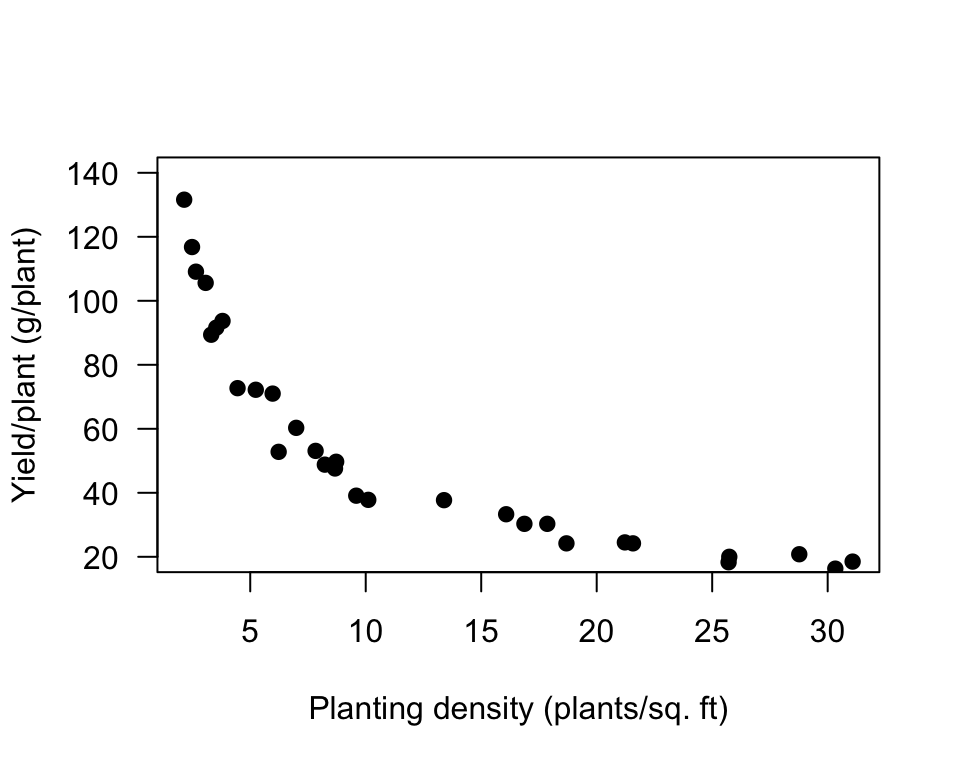
FIGURE 33.5: Onion yield plotted against planting density
The \(x\)-variable is
The form is best described as
The direction is best described as
The variation is best described as
References
Mead R. Plant density and crop yield. Applied Statistics. 1970;19(1):64–81.