24.13 Exercises
Selected answers are available in Sect. D.23.
Exercise 24.1 Earlier, we studied the NHANES study (Sect. 12.10), and this RQ:
Among Americans, is the mean direct HDL cholesterol different for current smokers and non-smokers?
Use the SPSS output (Fig. 24.15) to answer these questions.
- Construct an appropriate table showing the numerical summary.
- Determine, and suitably communicate, the 95% CI for the difference between the direct HDL cholesterol values between current smokers and non-smokers.
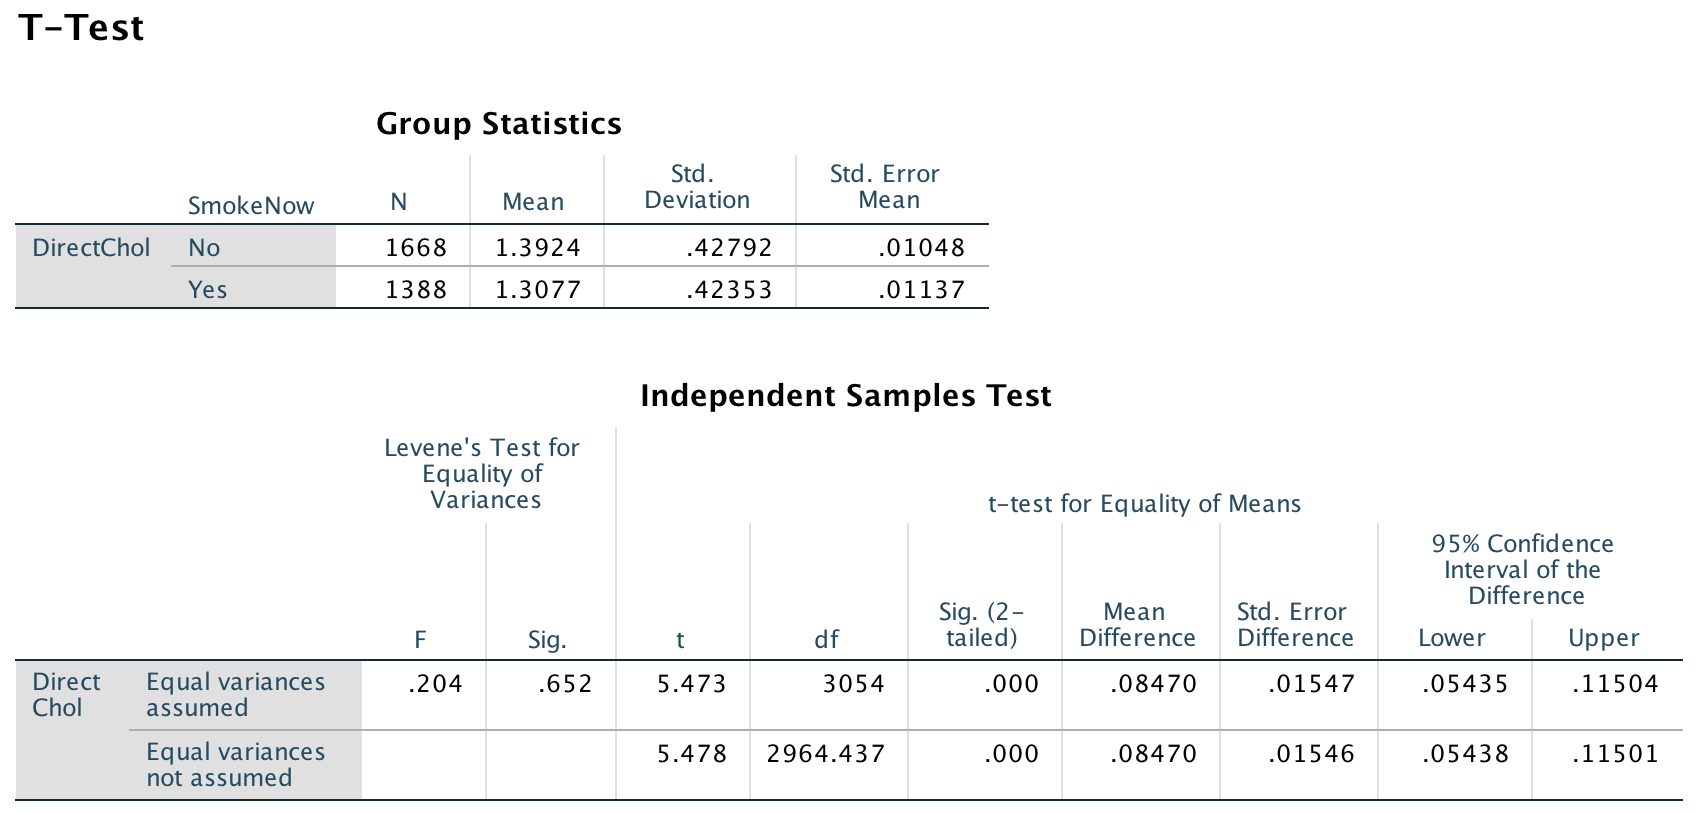
FIGURE 24.15: SPSS output for the NHANES data
Exercise 24.2 A study (Barrett et al. 2010) of the effectiveness of echinacea to treat the common cold compared, among other things, the duration of the cold for participants treated with echinaca or a placebo. Participants were blinded to the treatment, and allocated to the groups randomly. A summary of the data is given in Table 24.6.
- Compute the standard error for the mean duration of symptoms for each group.
- Compute an approximate 95% CI for the difference between the mean durations for the two groups.
- In which direction is the difference computed? What does it mean when the difference is calculated in this way?
- Compute an approximate 95% CI for the population mean duration of symptoms for those treated with echinacea.
- Are the CIs likely to be statistically valid?
| Mean | Std deviation | Std error | Sample size | |
|---|---|---|---|---|
| Placebo | 6.87 | 3.62 | 176 | |
| Echinacea | 6.34 | 3.31 | 183 | |
| Difference | 0.53 | 0.367 |
Exercise 24.3 Carpal tunnel syndrome (CTS) is pain experienced in the wrists. One study (Schmid et al. 2012) compared two different treatments: night splinting, or gliding exercises. Participants were randomly allocated to one of the two groups. Pain intensity (measured using a quantitative visual analog scale; larger values mean greater pain) were recorded after one week of treatment. The data are summarised in Table 24.7.
- Compute the standard error for the mean pain intensity for each group.
- In which direction is the difference computed? What does it mean when the difference is calculated in this way?
- Compute an approximate 95% CI for the difference in the mean pain intensity for the treatments.
- Compute an approximate 95% CI for the population mean pain intensity for those treated with splinting.
- Are the CIs likely to be statistically valid?
| Mean | Std deviation | Std error | Sample size | |
|---|---|---|---|---|
| Exercise | 0.8 | 1.4 | 10 | |
| Splinting | 1.1 | 1.1 | 10 | |
| Difference | 0.3 | 0.563 |
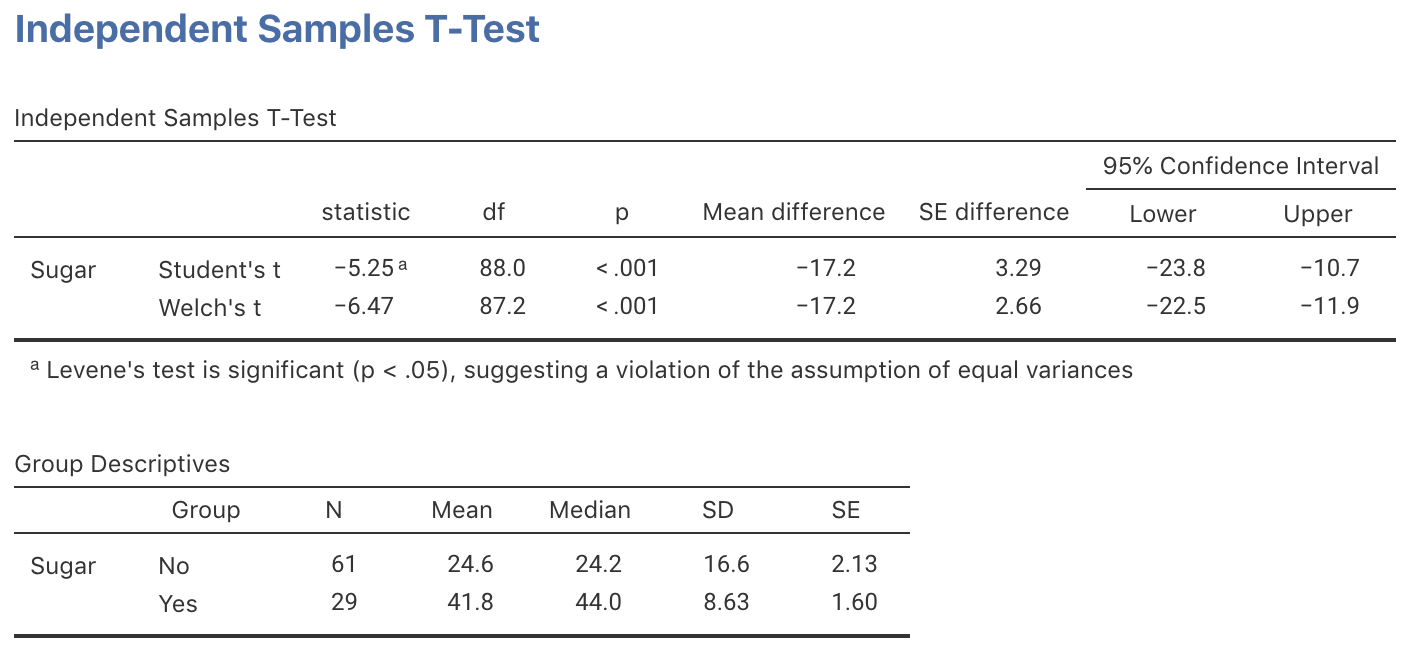
FIGURE 24.16: jamovi output for the sugar-consumption data