24.11 Example: Face-plant study
A study (Wojcik et al. 1999) compared the lean-forward angle in younger and older women. An elaborate set-up was constructed to measure this angle, using a harnesses.
Consider the RQ:
Among healthy women, what is difference between the mean lean-forward angle for younger women compared to older women?
The parameter is \(\mu_Y - \mu_O\), the difference between the two population means (younger, minus older).
The data are shown in Table 24.4. An appropriate graph for displaying the data is a boxplot or dotplot (since the sample sizes are small).
The appropriate numerical summary for the means of two independent samples summarises both groups, and (most importantly) the difference (Table 24.5). Summarising the difference is important, as the RQ is about those differences.
The error bar chart is the best plot for comparing the mean of the two groups (Fig. 24.12).
| 29 | 34 | 18 |
| 32 | 27 | 15 |
| 34 | 32 | 23 |
| 31 | 28 | 13 |
| 33 | 27 | 12 |
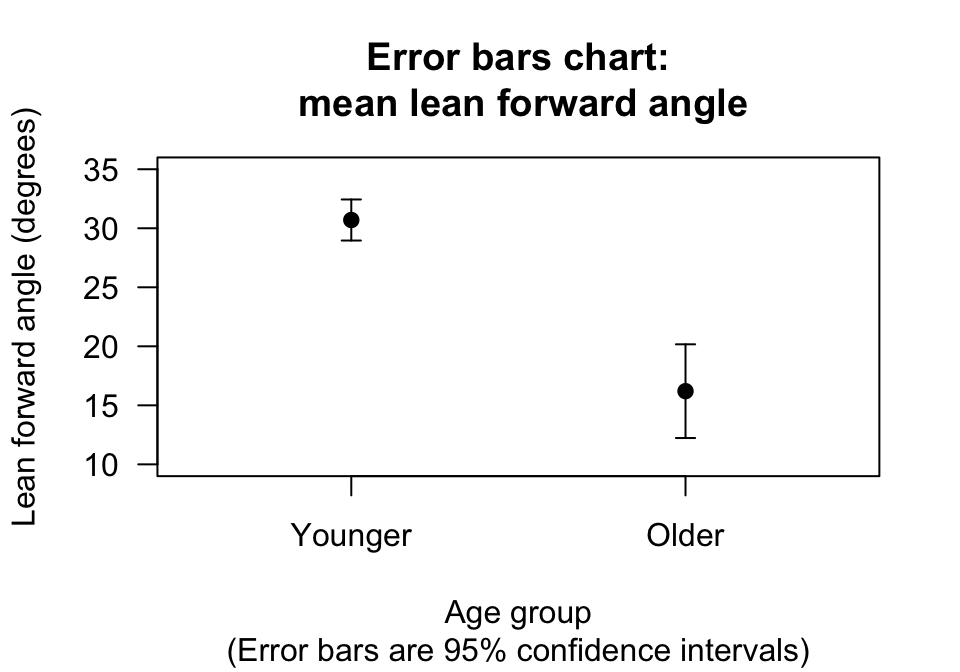
FIGURE 24.12: Plot of the face-plant data
| Mean | Standard deviation | Standard error | Sample size | |
|---|---|---|---|---|
| Younger women | 30.7 | 2.75 | 0.87 | 10 |
| Older women | 16.2 | 4.44 | 1.98 | 5 |
| Difference | 14.5 | 2.17 |
The second row of the jamovi output (Fig. 24.13) and SPSS output (Fig. 24.14) show that the 95% CI is from \(9.10\) to \(19.90\). (We could also compute the approximate 95% CI manually.) After rounding the numbers:
Based on the sample, a 95% CI for the difference between population mean one-step fall-recovery angle for heathy women is between \(9.1\) and \(19.9\) degrees greater for younger women than for older women (two independent samples).
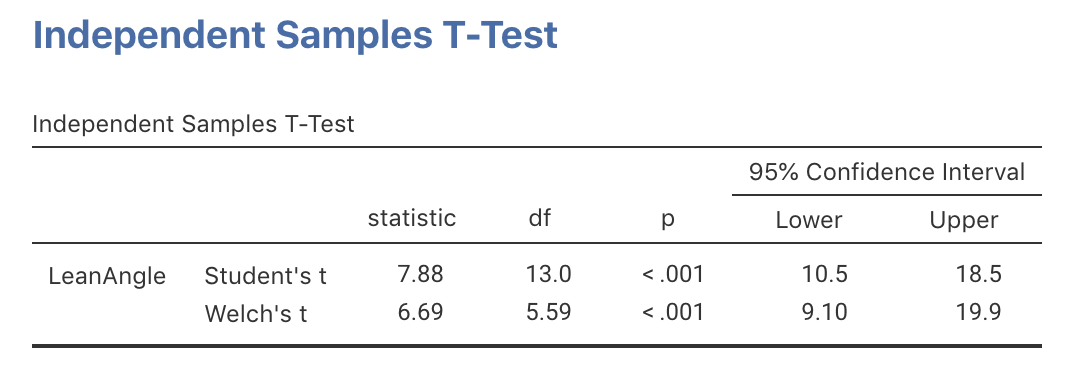
FIGURE 24.13: jamovi output for the face-plant data
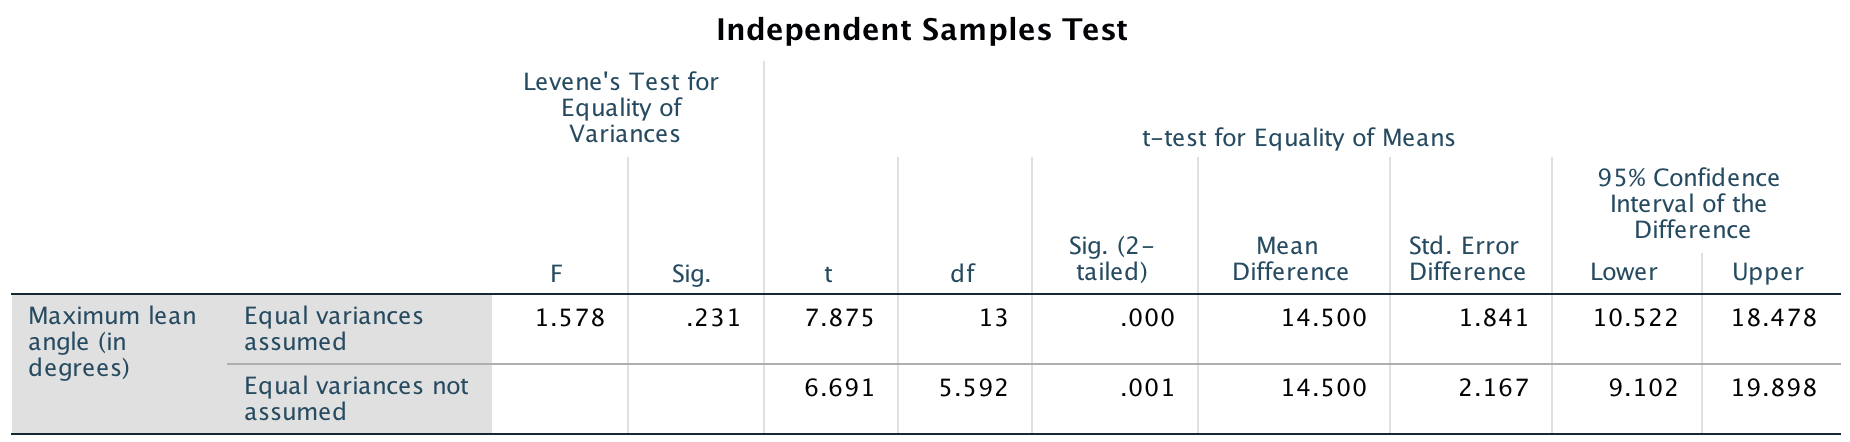
FIGURE 24.14: SPSS output for the face-plant data
The statement clearly states which group has the higher mean (younger women). This CI tells us that if we found many samples (of sizes 10 and 5) in the same way, and computed the CI for the difference between the mean from each sample, about 95% of the CIs would contain the difference between the means in the population: \(\mu_Y - \mu_{O}\). Loosely speaking: There is a 95% chance that our CI straddles \(\mu_Y - \mu_{O}\).
The CI may not be statistically valid (as the sample sizes are not large), so the CIs may not be accurate.