22.4 One mean: Statistical validity conditions
As with any inference procedure, the underlying mathematics requires certain conditions to be met so that the results are statistically valid. The CI for one mean, will be statistical valid if one of these is true:
- The sample size is at least 25, or
- The sample size is smaller than 25 and the population data has an approximate normal distribution.
The sample size of 25 is a rough figure here, and some books give other values (such as 30). This condition ensures that the distribution of the sample means has an approximate normal distribution so that the 68–95–99.7 rule can be used.
Provided the sample size is larger than about 25, this will be approximately true even if the distribution of the individuals in the population does not have a normal distribution. That is, when \(n>25\) the sample means generally have an approximate normal distribution, even if the data themselves don’t have a normal distribution.
In addition to the statistical validity condition, the CI will be
- internally valid if the study was well designed; and
- externally validity if the the sample is a simple random sample and is internally valid.
This is one reason why means are used to describe samples: under certain conditions, sample means have an approximate normal distribution (so the 68–95–99.7 rule applies). In contrast, the distribution of sample medians is far more complicated to describe.
To determine if assuming the population has an approximate normal distribution in the statistical validity condition, the histogram of the sample can be constructed. However, we can’t really be sure about the distribution of the population from the distribution of the sample. All we can reasonably do is to identify (from the sample) populations that likely to be very non-normal (when the CI would be not valid).

Example 22.2 (Assumptions) A study (Silverman et al. 1999; Zou et al. 2003) to examine exposure to radiation for CT scans in the abdomen assessed \(n=17\) patients. A histogram of the total radiation dose received is shown in Fig. 22.2; the sample mean dose is 26.86 rads.
A CI for the mean radiation dose received could be formed. However, as the sample size is ‘small’ (less than 25), the population must have a normal distribution for the CI to be statistically valid. Even though the histogram is from sample data, it seems improbable that the data in the sample would have come from a population with a normal distribution: the histogram of the sample data doesn’t look normally distributed at all.
Computing a CI for the mean of these data will probably be statistically invalid. Other methods (beyond the scope of this course) are possible for computing a confidence interval for the mean.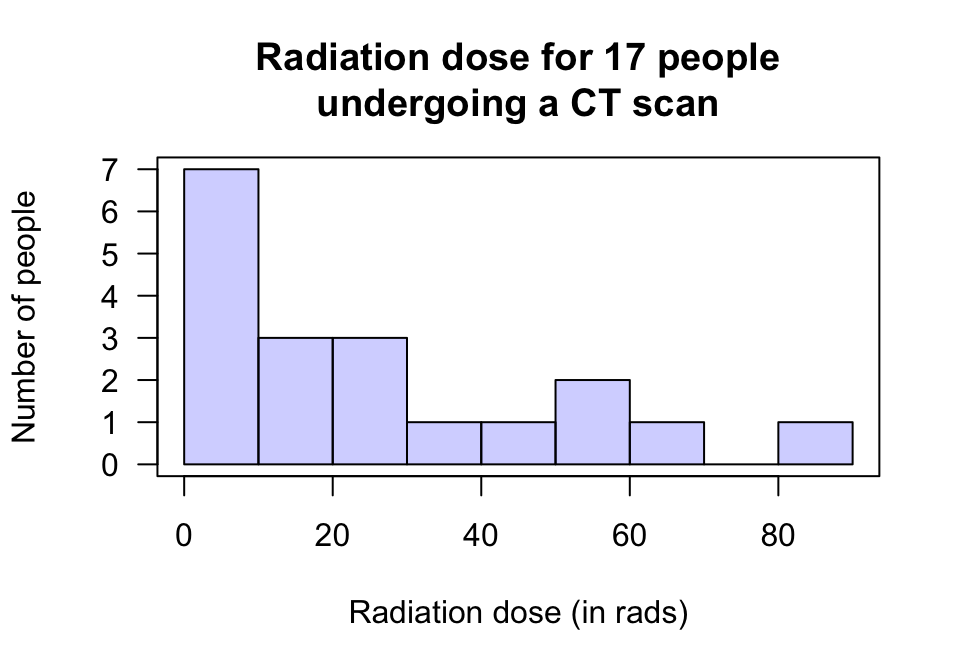
FIGURE 22.2: The radiation doses from CT scans for 17 people