23.12 Exercises
Selected answers are available in Sect. D.22.
Exercise 23.1 People often struggle to eat the recommended intake of vegetables. In one study exploring ways to increase vegetable intake in teens (Fritts et al. 2018), teens rated the taste of raw broccoli, and raw broccoli served with a specially-made dip.
Each teen (\(n = 101\)) had a pair of measurements: the taste rating of the broccoli with and without dip. Taste was assessed using a ‘100 mm visual analog scale,’ where a higher score means a better taste. In summary:
- For raw broccoli, the mean taste rating was \(56.0\) (with a standard deviation of \(26.6\));
- For raw broccoli served with dip, the mean taste rating was \(61.2\) (with a standard deviation of \(28.7\)).
Because the data are paired, the differences are the best way to describe the data. The mean difference in the ratings was \(5.2\), with \(\text{s.e.}(\bar{d}) = 3.06\). From this information:
- Construct a suitable numerical summary table.
- Compute the approximate 95% CI for the mean difference in taste ratings.
Exercise 23.2 In a study of hypertension (MacGregor et al. 1979; Hand et al. 1996), 15 patients were given a drug (Captopril) and their systolic blood pressure measured immediately before and two hours after being given the drug.
- Explain why it is sensible to compute differences as the Before minus the After measurements. What do the differences mean when computed this way?
- Compute the differences.
- Compute an approximate 95% CI for the mean difference.
- Write down the exact 95% CI using the computer output (jamovi: Fig. 23.7; SPSS: Fig. 23.8).
- Why are the two CIs different?
| Before | After | Before | After |
|---|---|---|---|
| 210 | 201 | 173 | 147 |
| 169 | 165 | 146 | 136 |
| 187 | 166 | 174 | 151 |
| 160 | 157 | 201 | 168 |
| 167 | 147 | 198 | 179 |
| 176 | 145 | 148 | 129 |
| 185 | 168 | 154 | 131 |
| 206 | 180 | NA | NA |
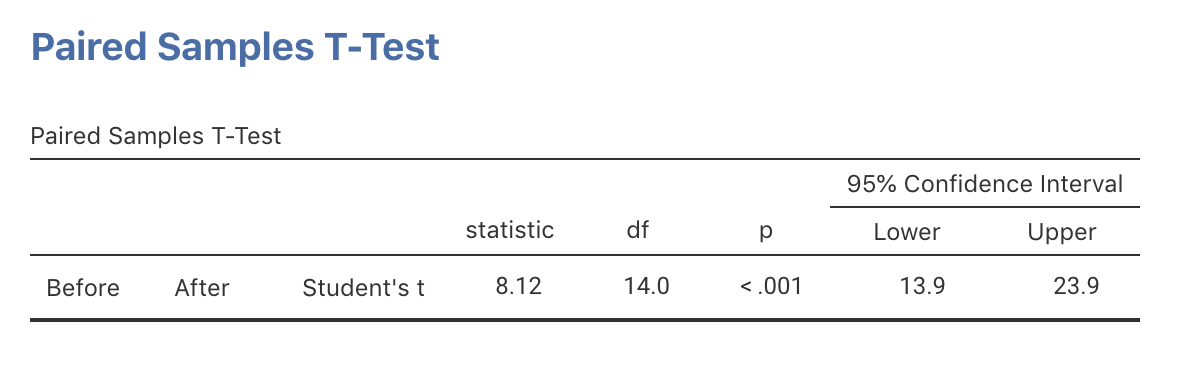
FIGURE 23.7: jamovi output for the Captoril data
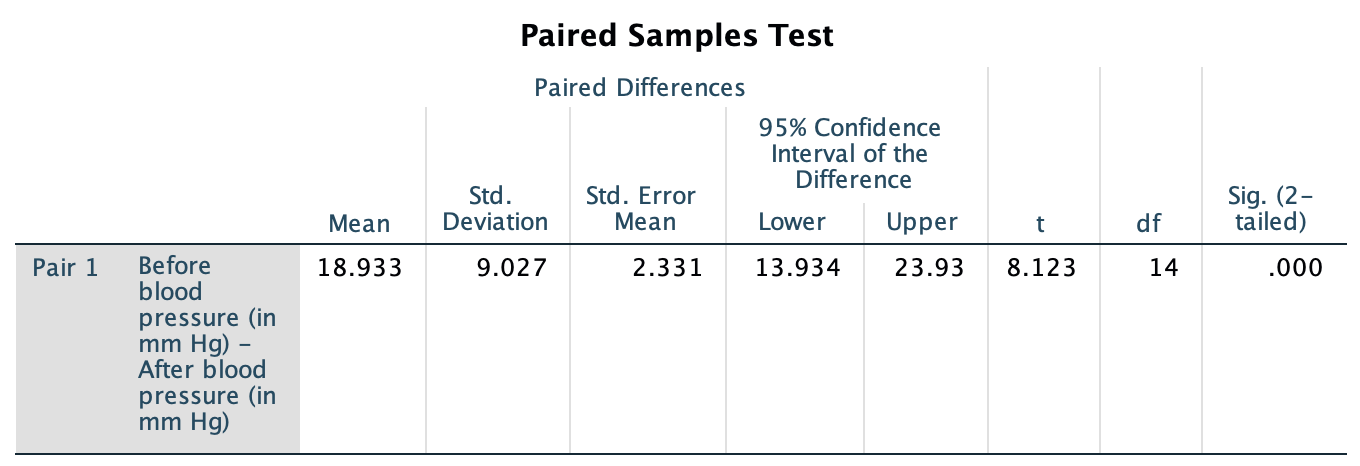
FIGURE 23.8: The Captoril data: SPSS output
Exercise 23.3 A study (Allen et al. 2018) examined the effect of exercise on smoking. Men and women were assessed on a range of measures, including the ‘intention to smoke.’
‘Intention to smoke’ was assessed both before and after exercise for each subject, using the 10-item quantitative Questionnaire of Smoking Urges – Brief scale (Cox et al. 2001), and the quantitative Minnesota Nicotine Withdrawal Scale (Shiffman et al. 2004).
Smokers (people smoking at least five cigarettes per day) aged 18 to 40 were enrolled for the study. For the 23 women in the study, the mean intention to smoke after exercise reduced by 0.66 (with a standard error of 0.37).
- Find a 95% confidence interval for the population mean reduction in intention to smoke for women after exercising.
- Is this CI statistically valid?