25.2 Comparing odds: Numerical and graphical summaries
With two qualitative variables, an appropriate numerical summary includes the odds and percentages from each comparison group for the outcome of interest, and the sample sizes.
From these data, the odds of eating most meals off-campus is:
- \(52\div 2 = 26\) for students living with their parents.
- \(105\div24 = 4.375\) for students not living with their parents.
So the odds ratio (OR) of eating most meals off-campus, comparing students living with parents to students not living with parents, is \(26 \div 4.375 = 5.943\).
The numerical summary (Table 25.2) shows the percentage and odds of eating most meals off-campus, comparing students living at home and those not living at home.
Understanding how software computes the odds ratio is important for understanding the output. In jamovi and SPSS, the odds ratio can be interpreted in either of these two ways:
The odds are the odds of eating most meals off-campus (Row 1 of Table 25.1).
Then, the odds ratio compares these odds for students living with their parents (Column 1 of Table 25.1) to those not living with their parents (Column 2 of Table 25.1).
That is, the odds are \(52/2= 26\) (for those living with parents) and \(105/24 = 4.375\) (for those not living with parents), so the OR is then \(26/4.375 = 5.943\), as in the output (Fig. 25.2).The odds are the odds of living with parents (Column 1 of Table 25.1).
Then, the odds ratio compares these odds for students eating most meals off-campus (Row 1 of Table 25.1) to the odds of students eating most meals on-campus (Row 2 of Table 25.1).
That is, the odds of living with parents are \(52/105= 0.49524\) (for those eating most meals off-campus) and \(2/24 = 0.083333\) (for those eating most meals on-campus), so the OR is then \(0.49524/0.083333 = 5.943\), as in the output (Fig. 25.2).
| Odds of having most meals off-campus | Percentage having most meals off-campus | Sample size | |
|---|---|---|---|
| Living with parents | 0.4952 | 16.6 | 54 |
| Not living with parents | 0.0833 | 3.8 | 129 |
| Odds ratio | 5.943 |
An appropriate graph (Fig. 25.1) is a side-by-side bar chart or a stacked bar chart. For comparing the odds, the side-by-side bar chart is better. (A stacked bar chart is better for comparing proportions, but either is fine.)
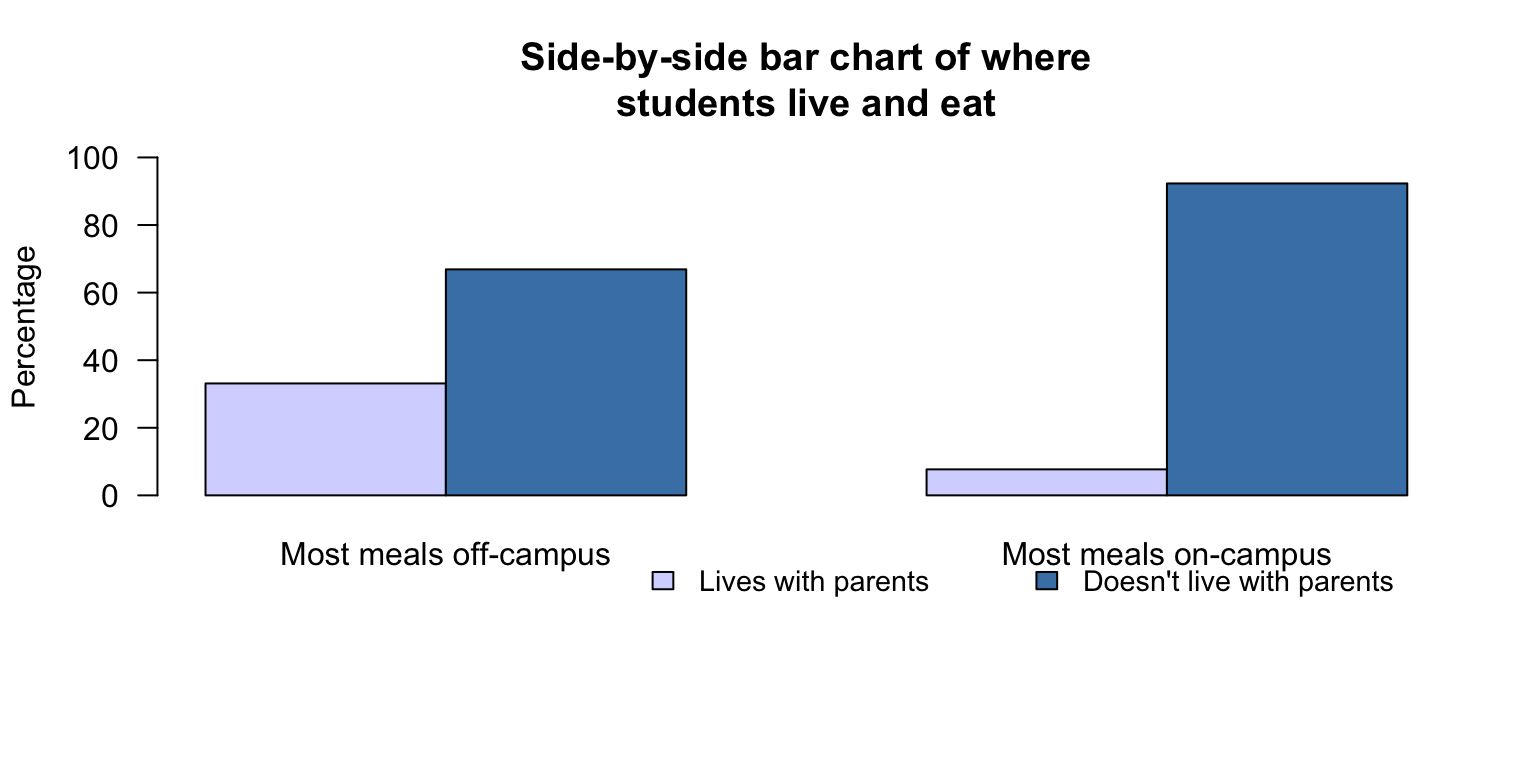
FIGURE 25.1: A plot of the uni-student eating data: A side-by-side bar chart