22.5 Example: NHANES
Previously, we asked this question about the NHANES data:
Among Americans, is the mean direct HDL cholesterol different for current smokers and non-smokers?
The response variable is direct HDL cholesterol concentration. The parameter is \(\mu\), the population mean HDL cholesterol concentration.
What is the population mean direct HDL cholesterol concentration?
From the data (using jamovi or SPSS), the sample mean is \(\bar{x} = 1.3649\) mmol/L; the standard deviation is \(s=0.39926\) mmol/L; and the sample size is \(n= 8474\).
The value of \(\bar{x}\) will vary from sample to sample; sampling variation exists. The standard error is:
\[
\text{s.e.}(\bar{x}) =
\frac{s}{\sqrt{n}}
=
\frac{ 0.39926}
{\sqrt{8474}} =
0.00434\text{ mmol/L}.
\]
The approximate 95% CI uses a multiplier of \(2\),
so the margin-of-error is
\[
2\times 0.0043
=
0.00867.
\]
The approximate 95% CI is \(1.365\),
give-or-take \(0.00867\);
or
from \(1.356\) to \(1.374\) mmol/L.
Based on the sample of size \(n= 8474\), a 95% CI for the population mean direct HDL cholesterol levels of Americans is between \(1.356\) and \(1.374\) mmol/L.
If many samples of the same size were found in the same way, and computed the CI from each, about 95% of the CIs would contain \(\mu\) (but this particular CI may or may not contain the value of \(\mu\)). We could also say that the CI gives a range of plausible values for \(\mu\), or that we are about 95% confident that this CI straddles the value of \(\mu\).
The statistical validity condition should also be checked to ensure the CI is statistically valid.
Since the sample size is much larger than 25, this CI for mean direct HDL cholesterol is statistically valid, even though the histogram of direct HDL cholesterol for individuals is skewed right (Fig. 22.3). Recall: the distribution of the sample means should be normally distributed, not the distribution of the data.
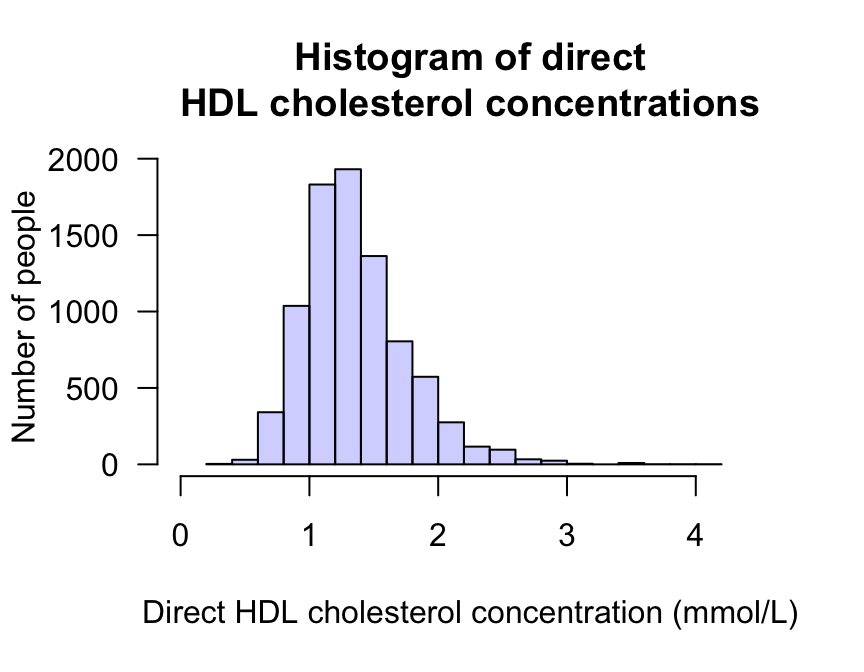
FIGURE 22.3: Histogram of direct HDL cholesterol concentration