24.7 Using software: CIs for the difference between means
The jamovi output (Fig. 24.5) and the SPSS output (Fig. 24.6) both show two CIs. We will use the results from the second row in both cases, as this row of output is more general (and makes fewer assumptions).
jamovi and SPSS give two confidence intervals.
In this book,
we will use the second row of information
(the Welch’s \(t\) row in jamovi;
the ‘Equal variance not assumed’ row in SPSS)
because it is more general and makes fewer assumptions.
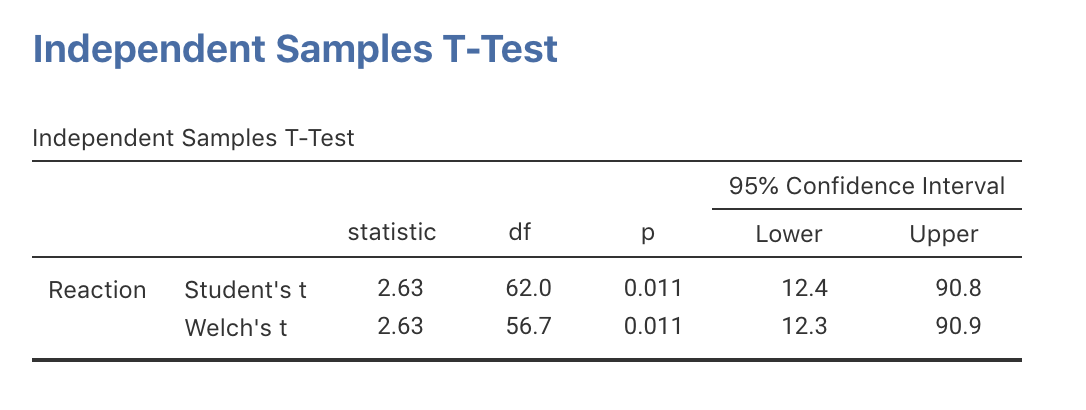
FIGURE 24.5: The jamovi output for the phone-reaction data
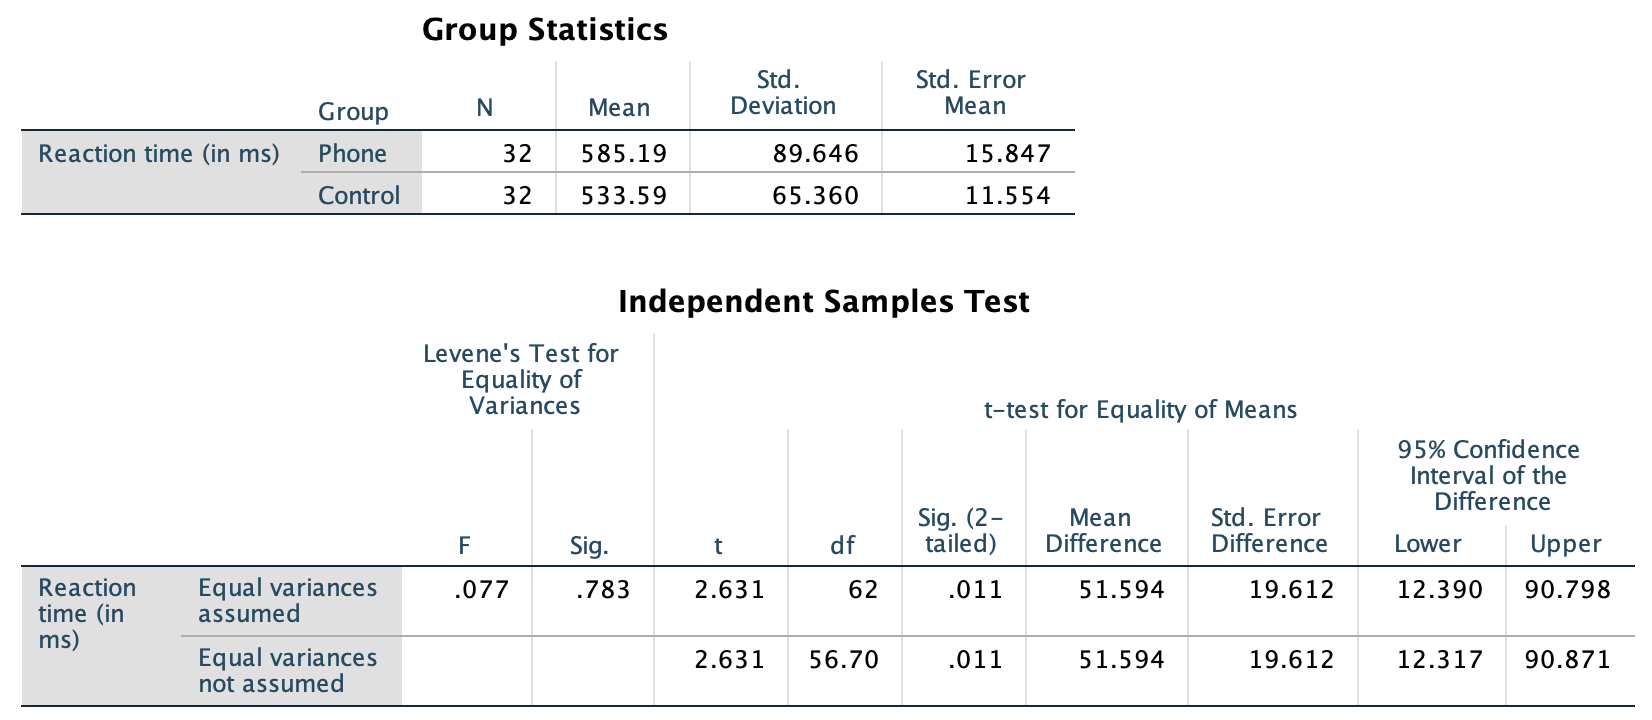
FIGURE 24.6: The SPSS output for the phone-reaction data
From the SPSS output, the standard error is \(\text{s.e.}(\bar{x}_P - \bar{x}_C) = 19.612\). From the jamovi or SPSS output, the exact 95% CI is from \(12.3\) to \(90.9\).
The approximate CI and the exact (from SPSS) CIs are only slightly different, as SPSS uses an exact multiplier (whereas manually an approximate \(t\)-multiplier of 2 is used, based on the 68–95–99.7 rule), and the sample sizes aren’t too small.