13.7 Observing relationships: The NHANES study
In Sect. 12.10, the NHANES data were introduced [Centers for Disease Control and Prevention (CDC) (1988--1994), Center for Disease Control and Prevention (1996), Pruim (2015)), and graphs were used to understand the data relevant to answering this RQ:
Among Americans, is the mean direct HDL cholesterol different for current smokers and non-smokers?
Using the software output (jamovi: Fig. 13.12; SPSS: Fig. 13.13), the direct HDL cholesterol can be summarised numerically:
- Average value:
- Sample mean: \(\bar{x} = 1.36\)mmol/L.
- Sample median: \(1.29\)mmol/L.
- Variation:
- Sample standard deviation: \(s=0.399\)mmol/L.
- Sample IQR: \(0.49\)mmol/L.
- Shape: Slightly skewed right (from Fig. 13.1 or 12.38).
- Outliers: SPSS identified some outliers (Fig. 12.38), mostly unusually large values.
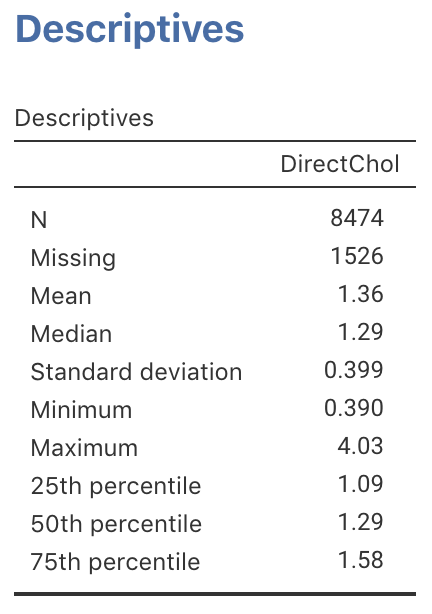
FIGURE 13.12: jamovi output for direct HDL cholesterol
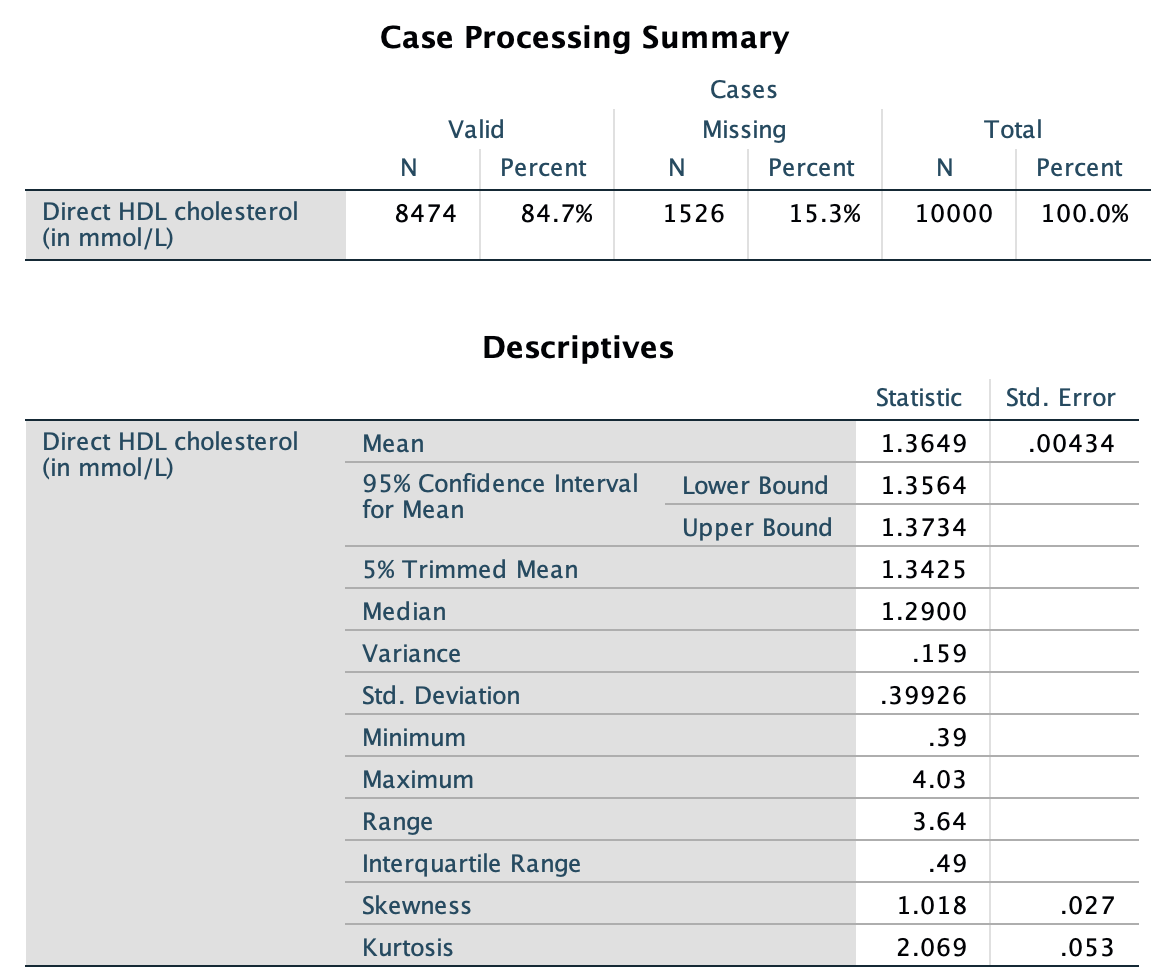
FIGURE 13.13: SPSS output for direct HDL cholesterol
The RQ is about comparing the mean direct HDL cholesterol in the two smoking groups, so compiling a table of summaries for each group is useful, using different output (jamovi: Fig. 13.14; SPSS: Fig. 13.15). Table 13.8 shows the numerical summaries of direct HDL cholesterol for each group.
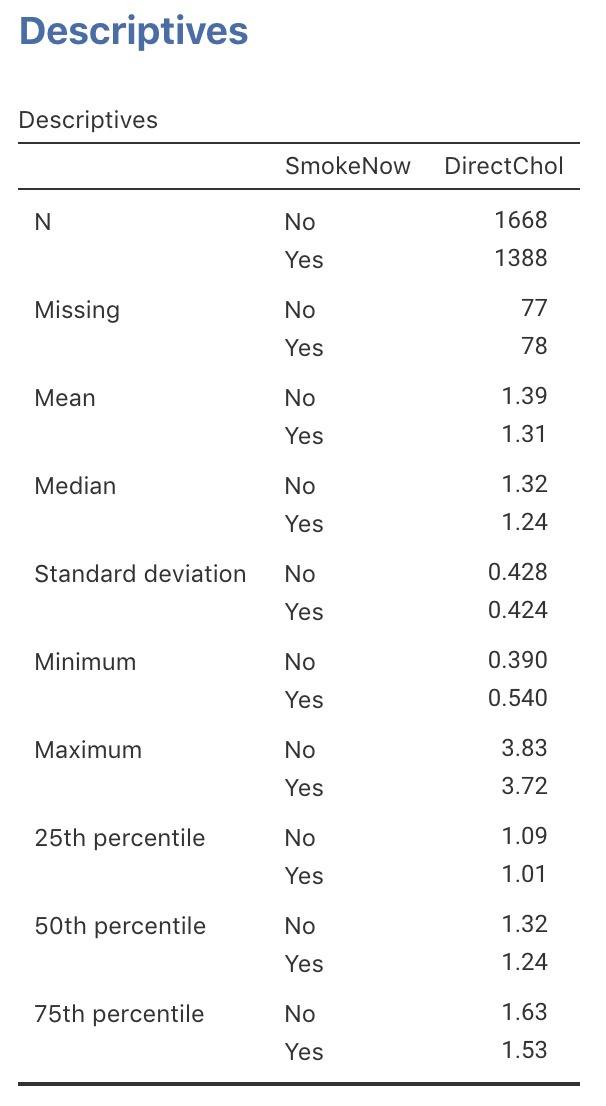
FIGURE 13.14: jamovi output for direct HDL cholesterol, by current smoking status
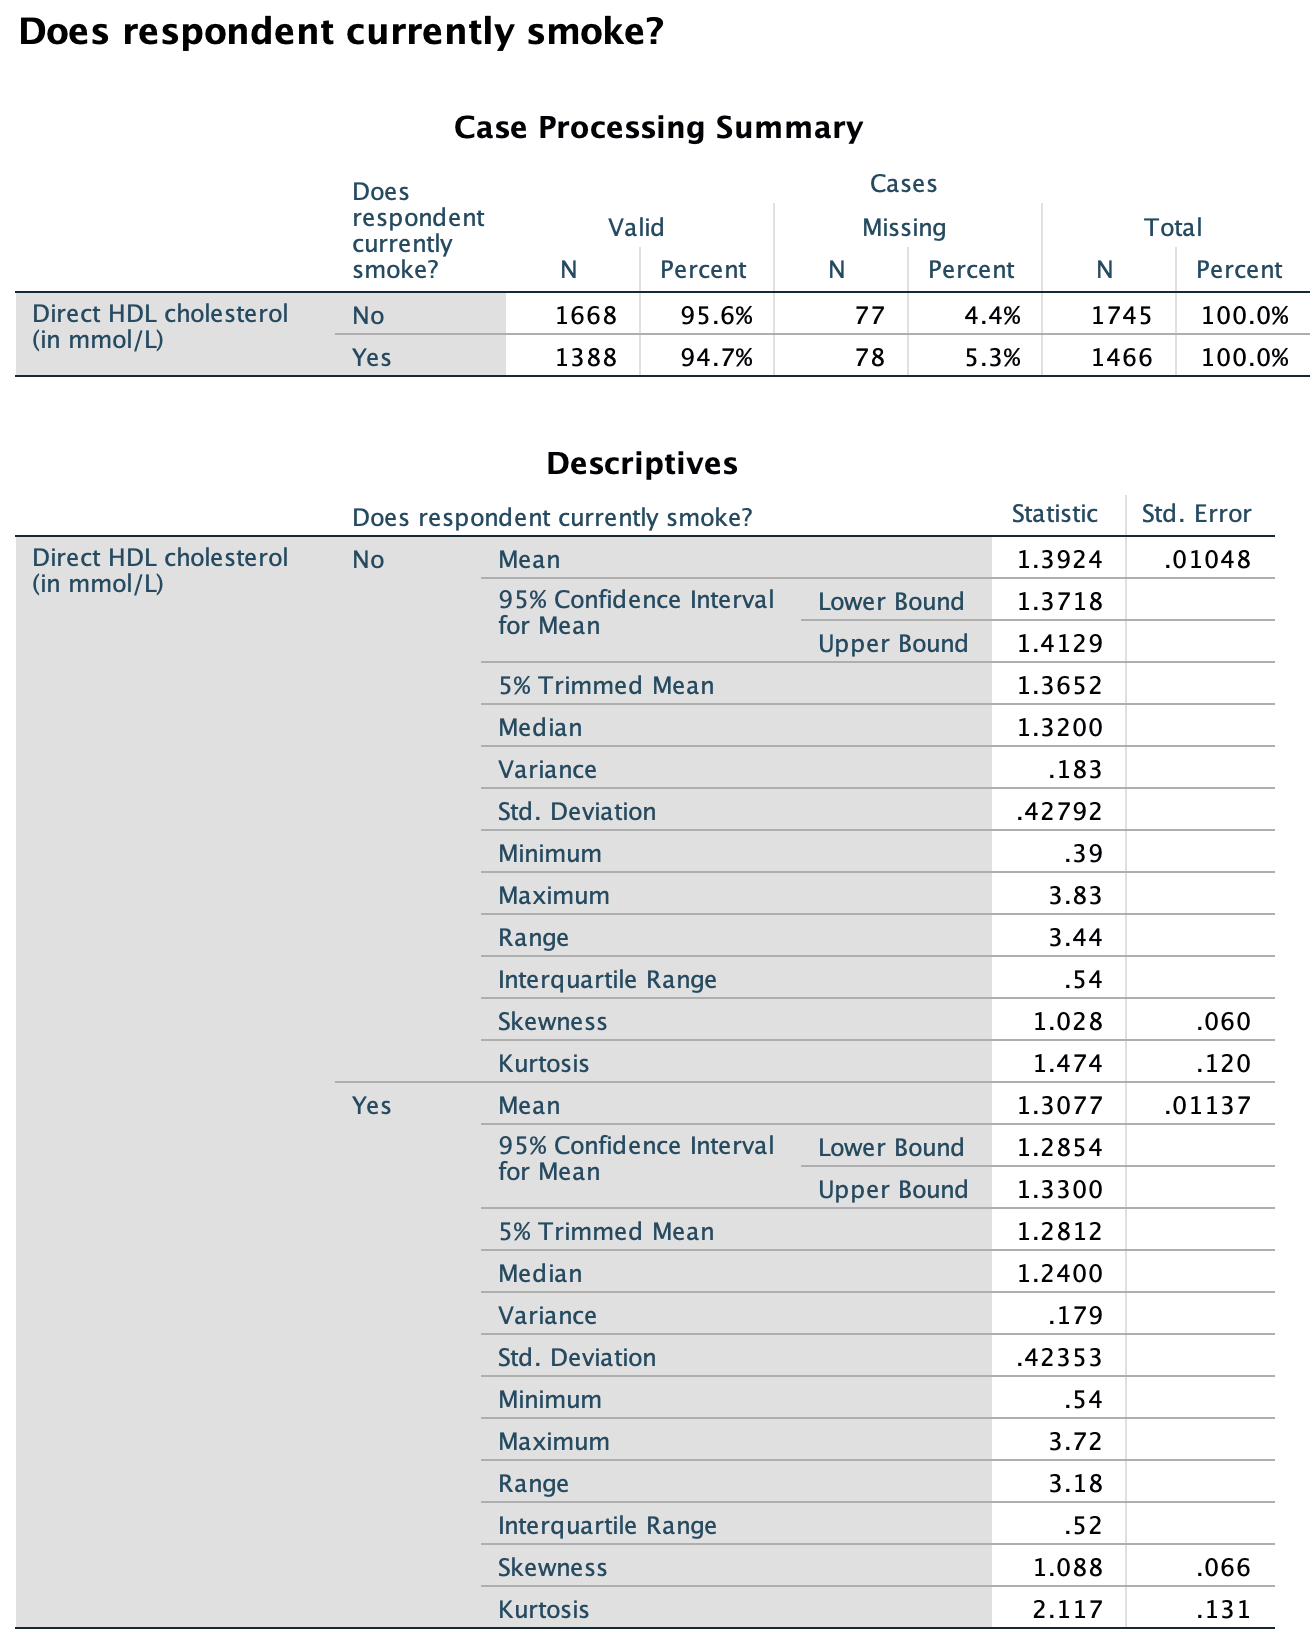
FIGURE 13.15: SPSS output for direct HDL cholesterol, by current smoking status
| Group | Sample size | Mean | Median | Std. dev. | IQR |
|---|---|---|---|---|---|
| All participants: | 8474 | 1.36 | 1.29 | 0.399 | 0.49 |
| Smokers: | 1388 | 1.31 | 1.24 | 0.424 | 0.52 |
| Non-smokers: | 1668 | 1.39 | 1.32 | 0.428 | 0.54 |
The RQ, as usual, asks about the population. The RQ cannot be answered with certainty, only using a sample, since every sample is likely to be different.
Clearly, the sample means are different, but the RQ asks if the population means are different. Broadly, two possible reasons could explain why the sample mean direct HDL cholesterol is different for current smokers and non-smokers:
The population means are the same, but the sample means are different simply because of the people who ended up in the sample. Another sample, with different people, might produce different sample means. Sampling variation explains the difference in the sample percentages.
The population means are different, and the difference between the sample means simply reflects this difference between the population means.
The difficulty, of course, is knowing which of these two reasons (‘hypotheses’) is the most likely reason for the difference between the sample means. This question is of prime importance (after all, it answers the RQ), and is addressed at length later in this book.