5.11 Final example

As a demonstration sampling schemes (Marshman and Dunn Submitted), consider taking a non-random sample of 10% of the pixels of an image (Fig. 5.3). What is the image? Seeing the big picture is hard using these non-random samples.

Non-random samples from an image: 5 percent of pixels (top left); 10 percent of pixels (top right); 25 percent of pixels (bottom left); 50 percent of pixels (bottom right)Non-random samples from an image: 5 percent of pixels (top left); 10 percent of pixels (top right); 25 percent of pixels (bottom left); 50 percent of pixels (bottom right)Non-random samples from an image: 5 percent of pixels (top left); 10 percent of pixels (top right); 25 percent of pixels (bottom left); 50 percent of pixels (bottom right)Non-random samples from an image: 5 percent of pixels (top left); 10 percent of pixels (top right); 25 percent of pixels (bottom left); 50 percent of pixels (bottom right)

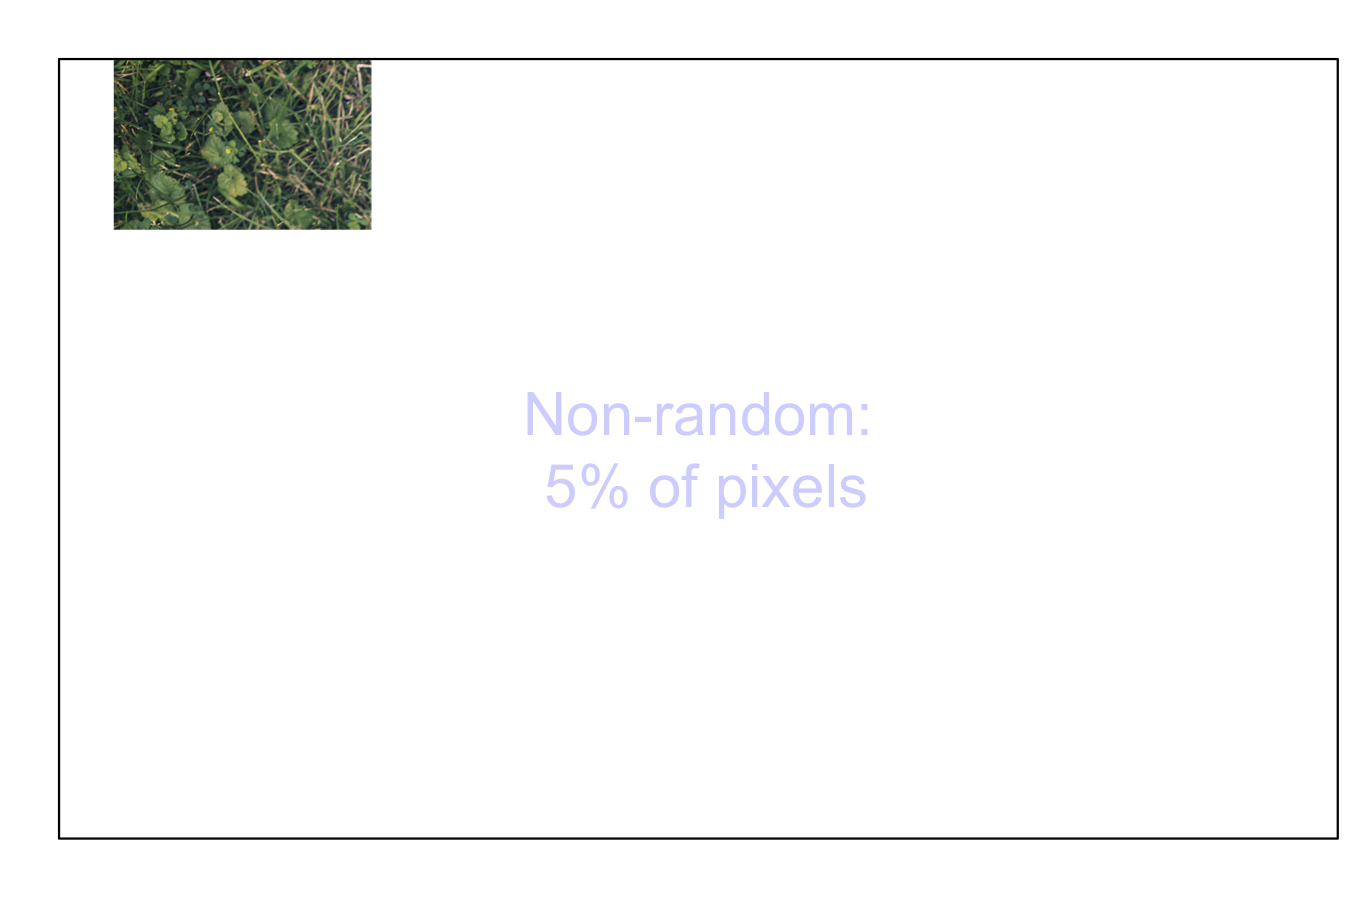
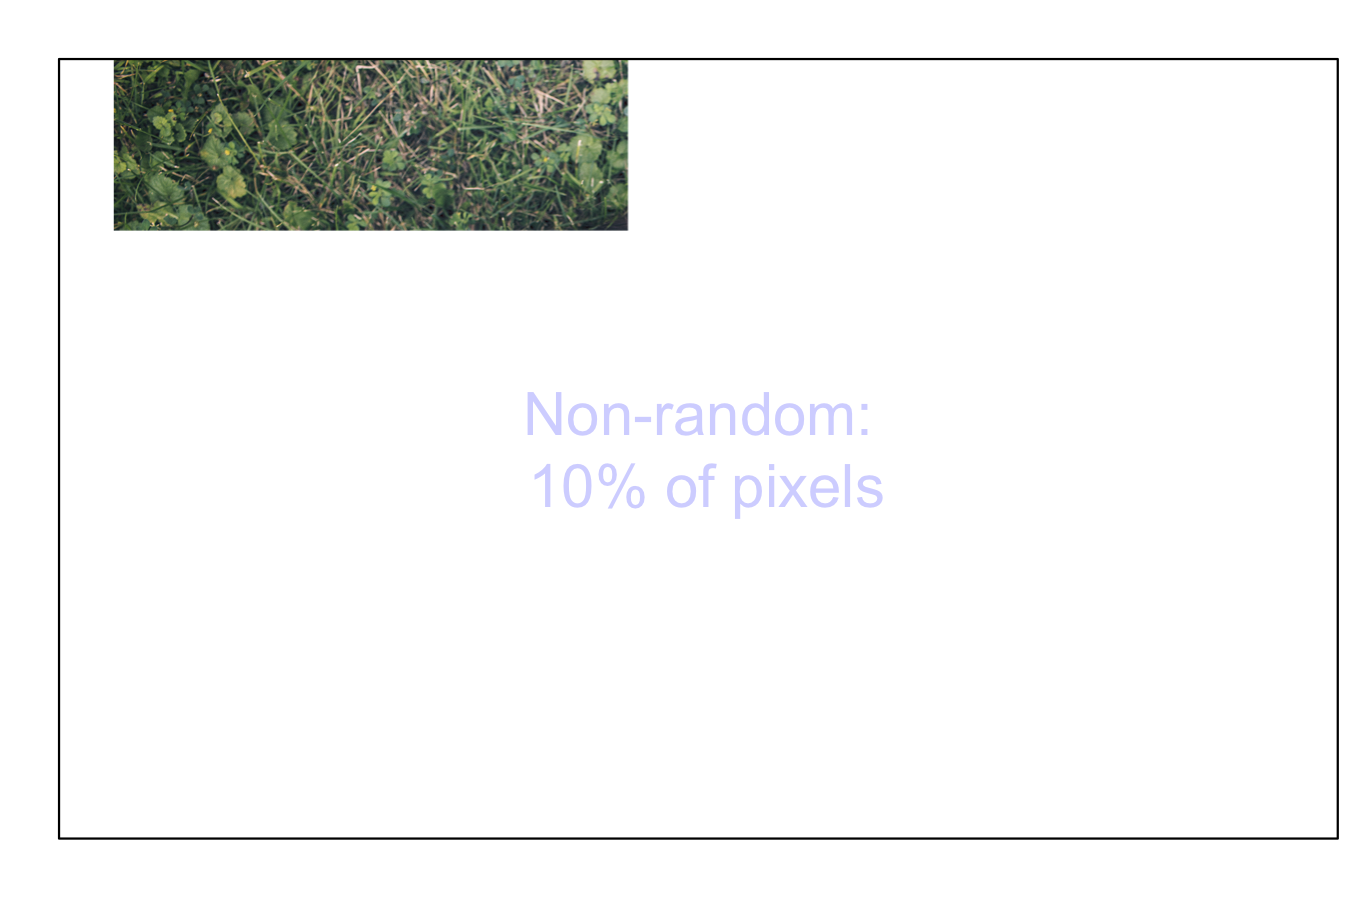
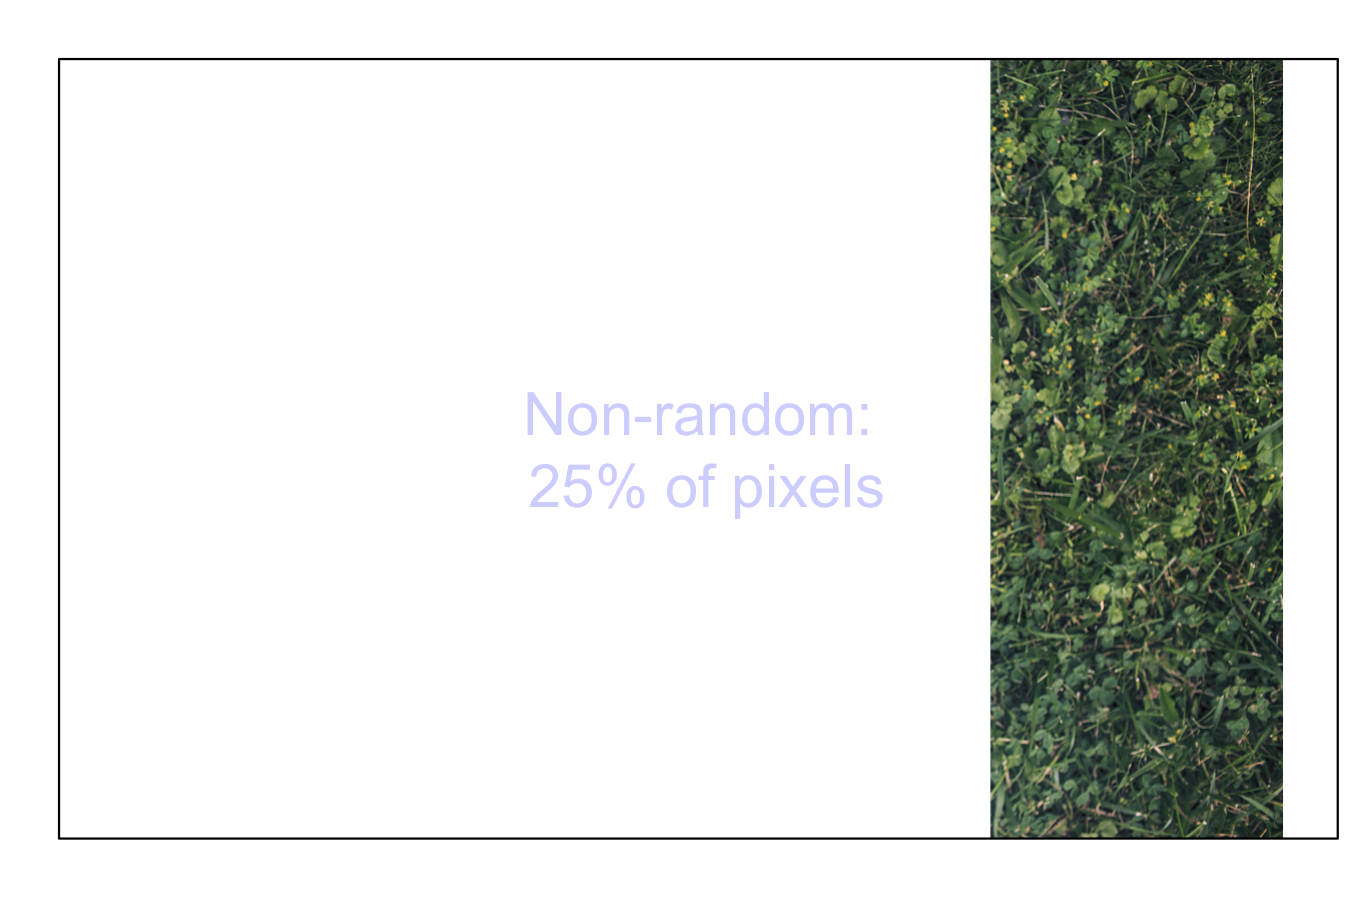
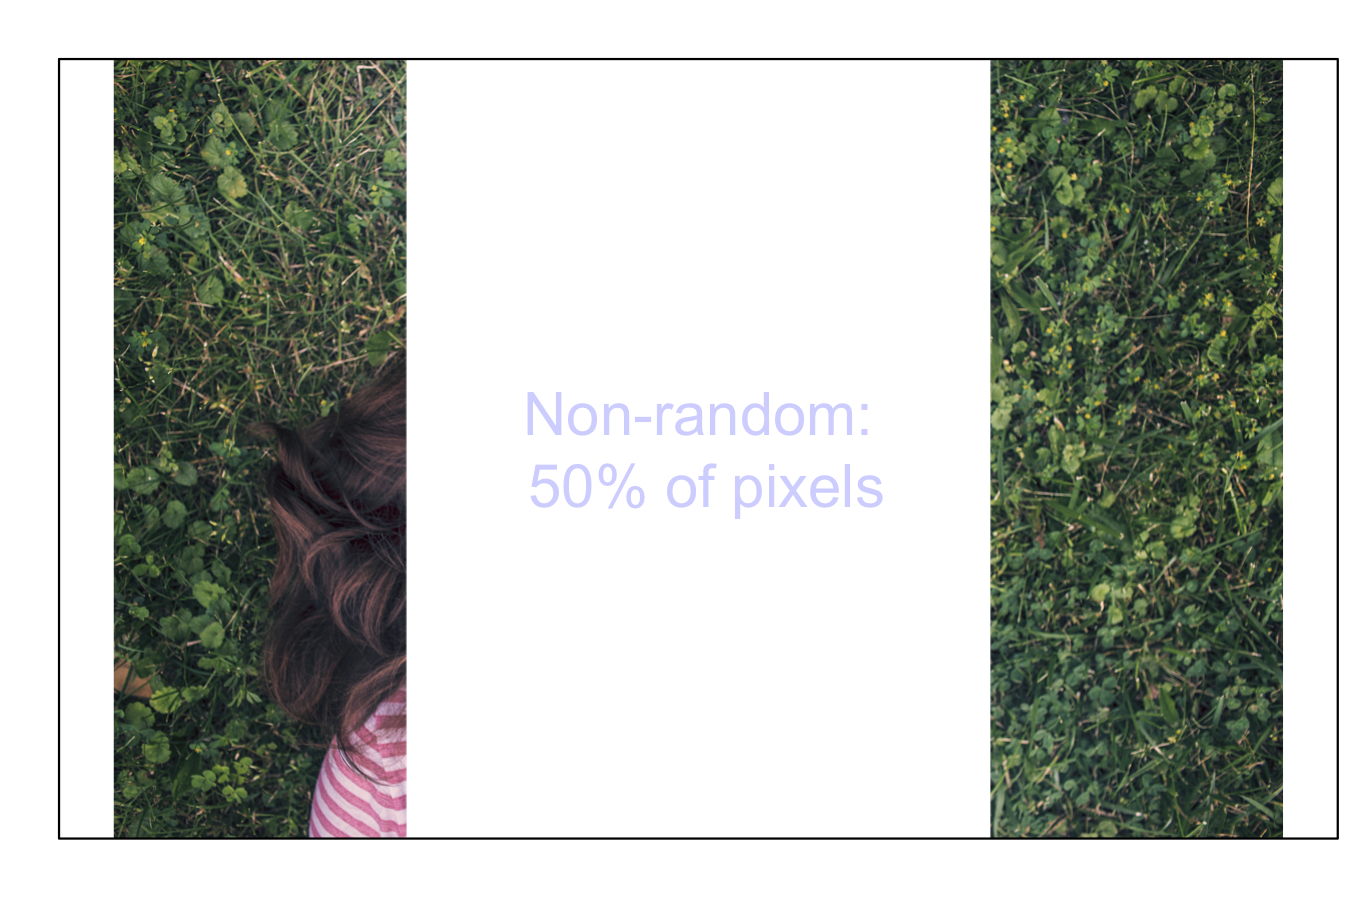
FIGURE 5.3: Non-random samples from an image: 5 percent of pixels (top left); 10 percent of pixels (top right); 25 percent of pixels (bottom left); 50 percent of pixels (bottom right)

In contrast, taking simple random sample makes the big picture much clearer (Fig. 5.4).

Random samples from an image: 5 percent of pixels (top left); 10 percentof pixels (top right); 25 percent of pixels (bottom left); 50 percent of pixels (bottom right)Random samples from an image: 5 percent of pixels (top left); 10 percentof pixels (top right); 25 percent of pixels (bottom left); 50 percent of pixels (bottom right)Random samples from an image: 5 percent of pixels (top left); 10 percentof pixels (top right); 25 percent of pixels (bottom left); 50 percent of pixels (bottom right)Random samples from an image: 5 percent of pixels (top left); 10 percentof pixels (top right); 25 percent of pixels (bottom left); 50 percent of pixels (bottom right)

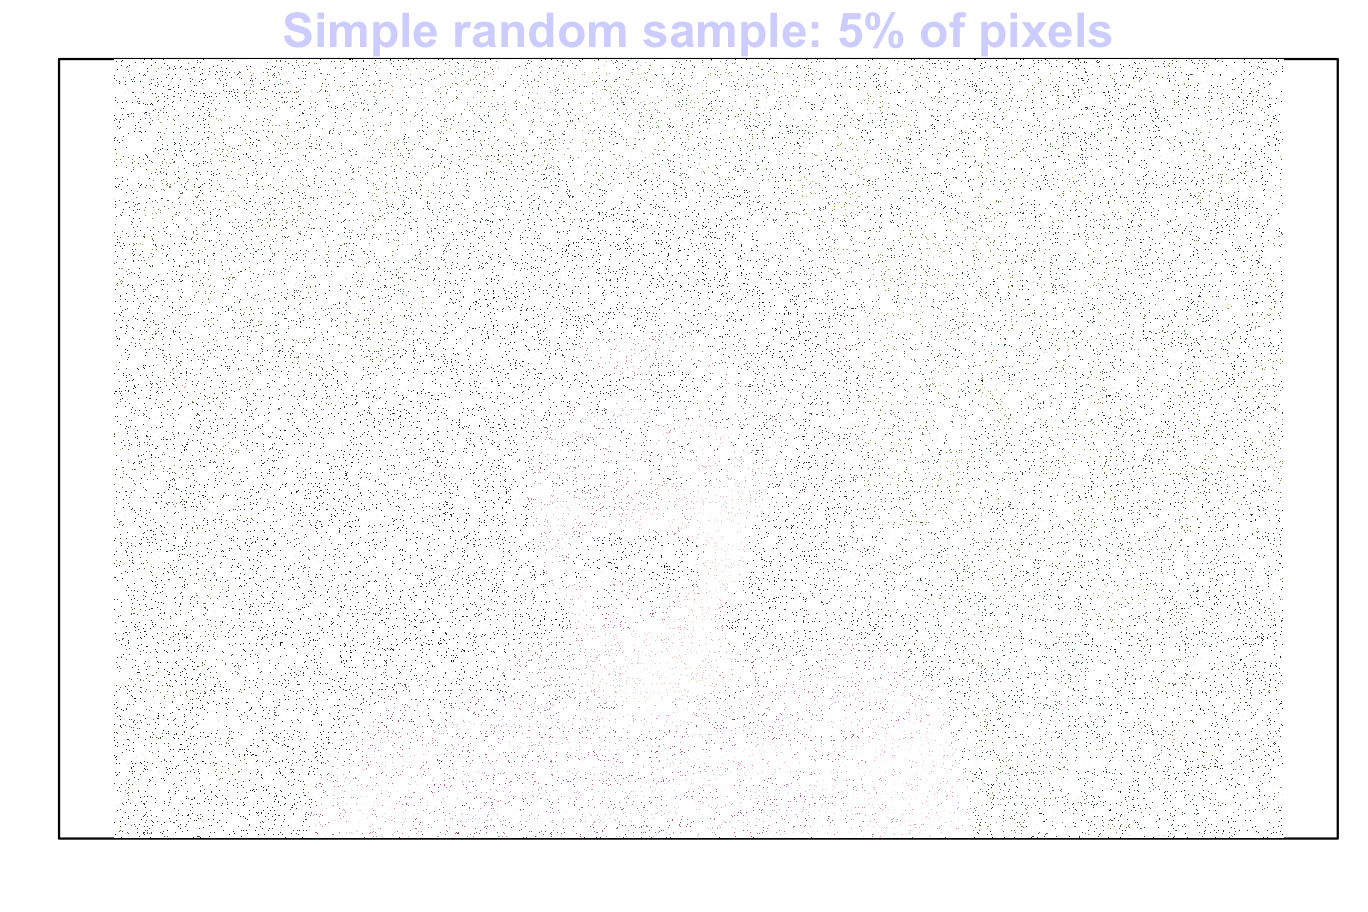
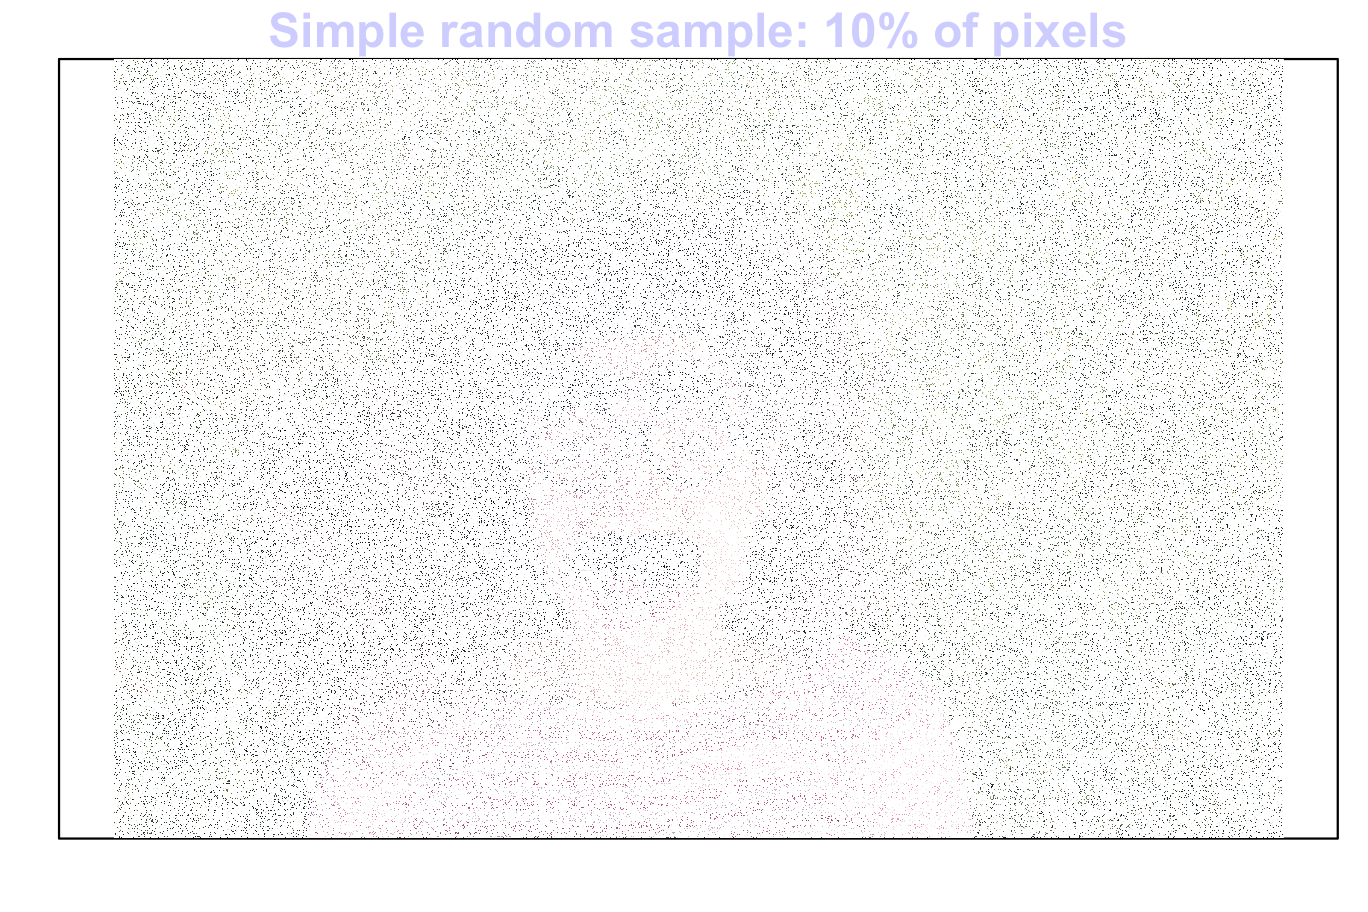
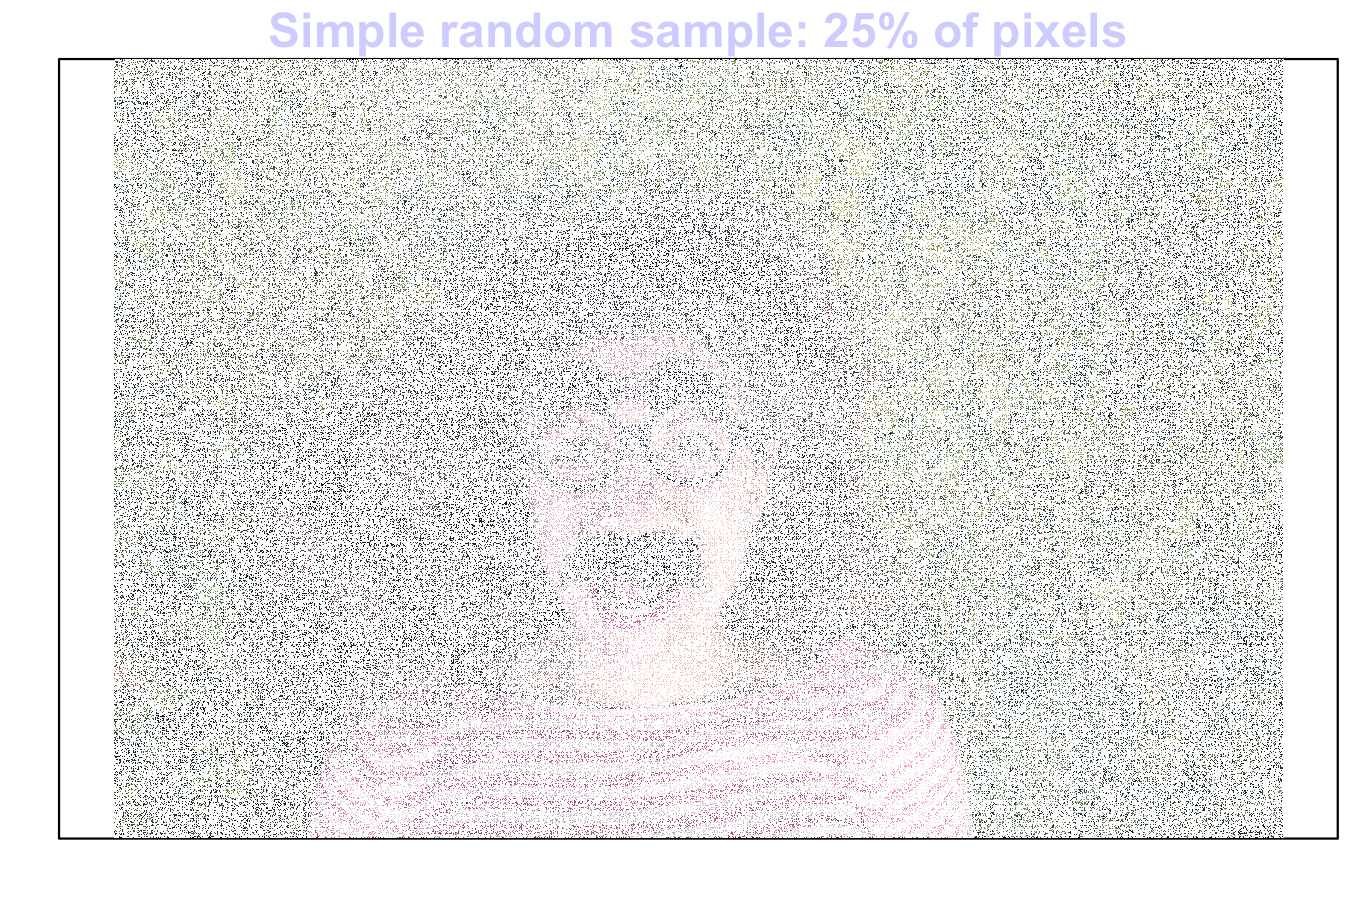
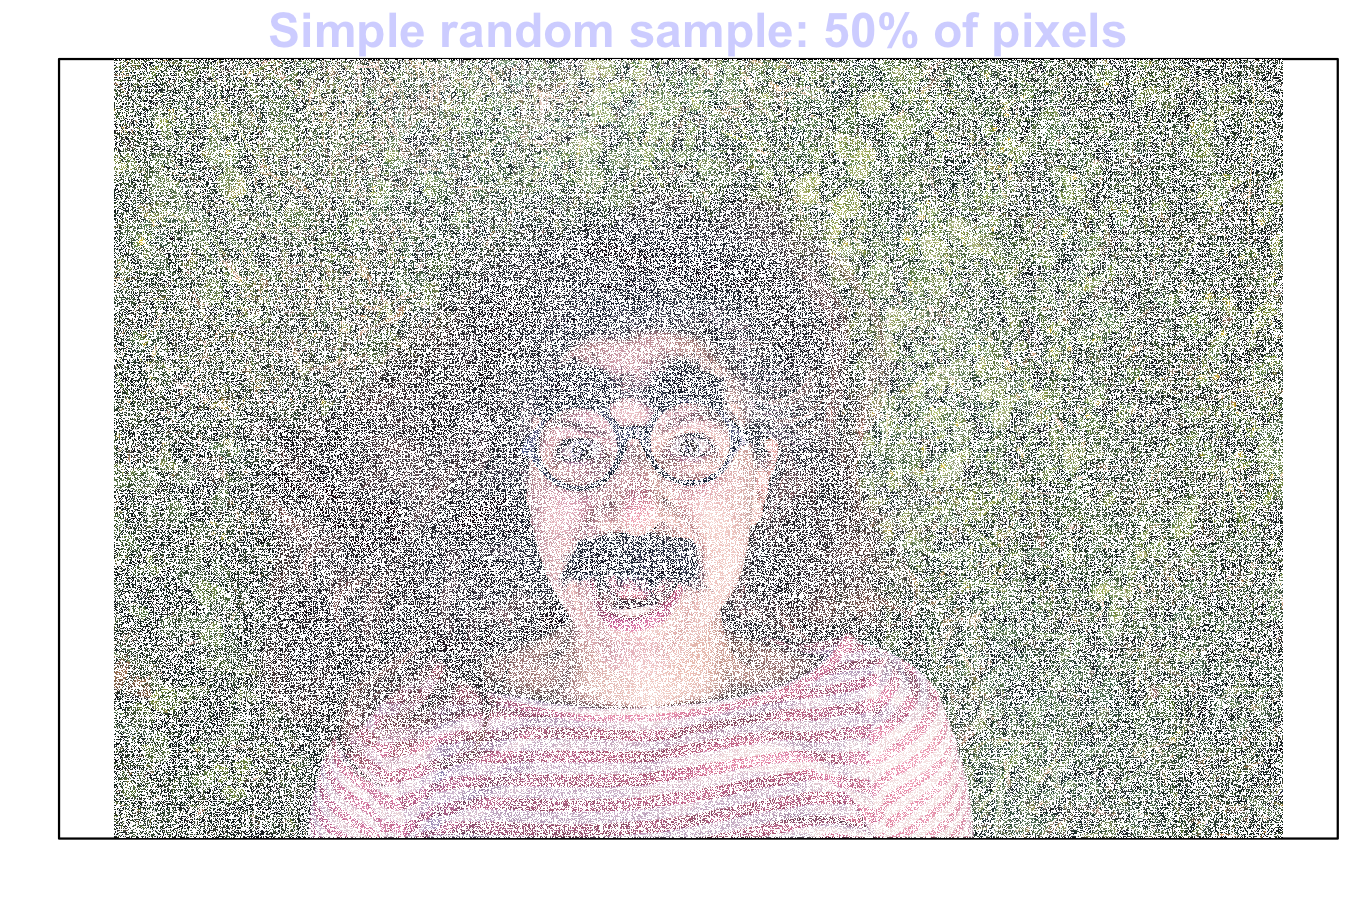
FIGURE 5.4: Random samples from an image: 5 percent of pixels (top left); 10 percentof pixels (top right); 25 percent of pixels (bottom left); 50 percent of pixels (bottom right)

Indeed, any type of random sample makes seeing the big picture easier.

For example, for a cluster sample we treat each column as a cluster, and select some columns at random. Then, the entire chosen columns are selected.

For a systematic sample, we take:

  • every 20th pixel for a 5% sample;
  • every 10th pixel for a 10% sample;
  • every 4th pixel for a 25% sample; and
  • every second pixel for a 50% sample.

For a multi-stage sample we select some columns at random, then select some pixels in those columns at random.

For a stratified sample, we select :

  • a simple random sample from the background greenery, and then
  • a simple random sample from the person.

These two are then combined to get an overall random sample.

References

Marshman M, Dunn PK. Teaching statistics with experiential learning: A visual experience. Submitted;