7.2 Managing confounding
Confounding has the potential to compromise the internal validity of the study and hence the interpretation of the results, so managing the impact of confounding is important. Suppose, for example, that the researchers created two groups:
- Group A: Women recruited at a female-only gym.
- Group B: Men recruited at a local nursing home.
The researchers then gave Himalaya 292 to Group A, and the refined cereal to Group B. If a difference in faecal weight was found between the two groups, the difference may because:
- The diet (the explanatory variable) was different in each group;
- The sex of the participants was different in both groups, since Group A was all women and Group B was all men;
- The age of the participants in each group, since Group A is likely to be younger on average, and Group B is likely to be older on average;
- The health and fitness levels in each group: those in Group A would generally be far healythier than those in Group B.
If a difference is found between the Himalaya 292 and refined cereal groups, it may not be because of the cereal (Table 7.1). For example, the age of the subject may be related to faecal weight (as older people tend to eat less), and the study design means that older people are more likely to consume the refined cereal. This study has extremely poor internal validity. This is an extreme case of confounding; usually confounding is more subtle than in this example.
|
|
|


Example 7.1 (Comparing groups) An experiment to study the effect of using ginko to enhance memory (Solomon et al. 2002) compared two groups: one using ginko (\(n=111\)) and a pretend, non-active supplement (\(n=108\)).
The authors randomly allocated participants to each group, but also compared the two groups to ensure that no obvious differences initially existed between the two groups that might explain any differences in the response variable (Table 7.2).
The table shows that the two groups are very similar on these variables, so any difference between the groups cannot be attributed to existing difference in the age, the percentage of men, or the years of education in the two groups.| Characteristic | Group A (Ginko) | Group B (Pretend) |
|---|---|---|
| Average age (in years): | 68.7 | 69.9 |
| Mean (number; percentage) | 46 (41) | 45 (42) |
| Average years of education | 14.4 | 14.0 |
Potentially, many extraneous variables exist. To demonstrate, we will consider just one: age. How can we make sure that the age of the participants does not cause confounding?
Confounding can be managed by:
- Restricting the study to a certain group (for example, only people under 30).
- Blocking. Analyse the data separately for different groups (for example, analyse the data separately for people under 30, and 30 and over).
- Analysing using special methods (after measuring the age of each subject).
- Randomly allocating people to groups: Older and younger people would be spread approximately evenly between groups.
The first two approaches (restricting; blocking) are useful if one or two variables are known, or thought likely, to cause confounding. The third approach (analysing) requires recording all the variables suspected of being confounders. The fourth approach (randomly allocating) is superior if it is possible, because it reduces the chance of confounding even for variables not even suspected as being confounding variables. Notice that a common theme is to measuring, observing, assessing or recording any variables of potential concern, to ensure no lurking variables exist to compromise the results.
Of course, more than one of these approaches can be used, such as randomly allocating individuals to groups, but also measuring, observing, assessing or recording many other variables that can be managed through analysis (Example 7.1).
7.2.1 Restrictions
Sometimes the impact of confounding is managed by restricting the study to some groups, based on potential confounding variables, or keeping some variables constant. These variables are called control variables. If possible, a reason for this restriction should be given.
7.2.2 Blocking
Sometimes blocking is used to minimise the impacts of confounding. Blocking refers to separating the units of analysis into a small number of groups that are similar to one another, then studying those groups separately. The Himalaya study, might be blocked on age (Fig. 7.1).
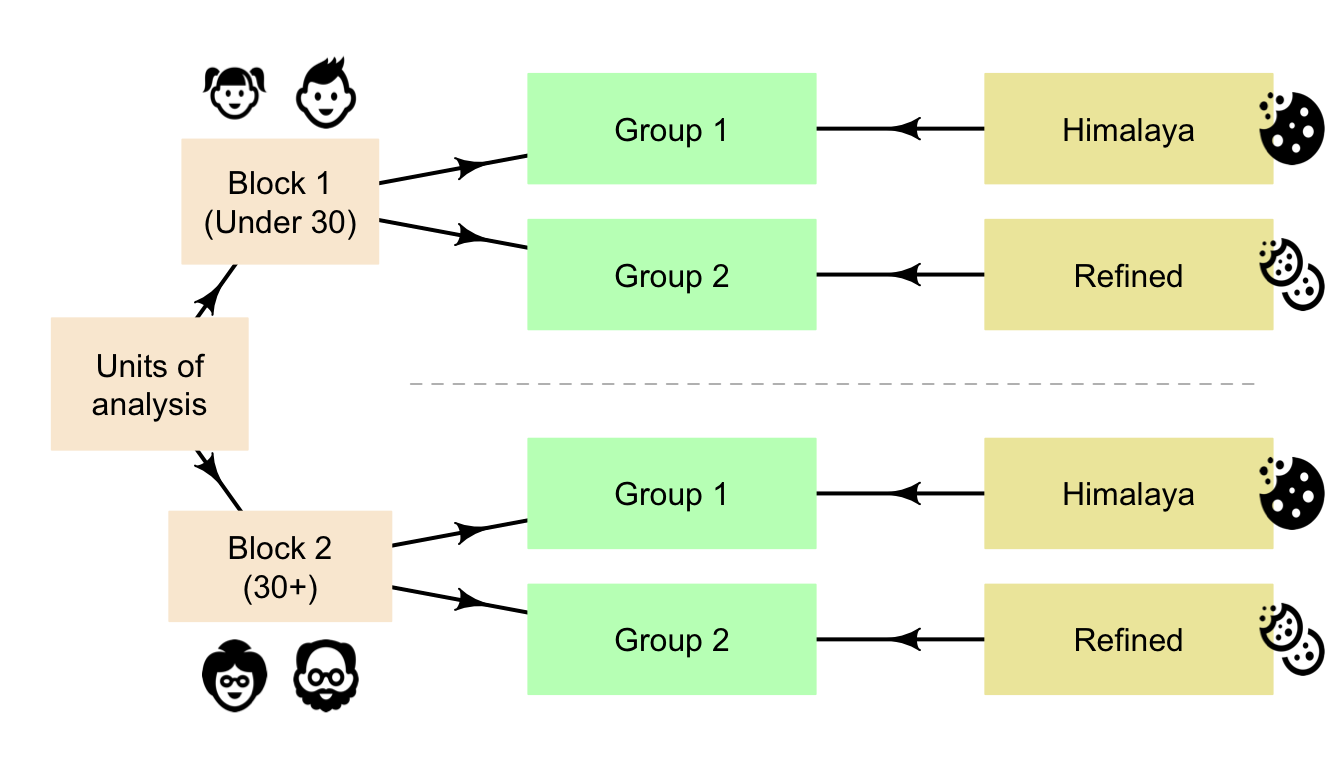
FIGURE 7.1: Blocking in the Himalaya study, based on age
7.2.3 Analysis
Confounding variables can be accommodated in the analysis (using analysis methodology beyond what is in this book), provided those variables have been measured, observed, assessed or recorded. Because of this, measuring, observing, assessing or recording all the information likely to be important for understanding the data is important.
Measure, observe, assess or record all all the information that is likely to be important for understanding the data. This may include information about
- the individuals in the study; and
- the circumstances of the study.
For this reason, most studies involving people record the participants’ age and sex, as these two variables are common confounders. Once a sample is obtained, recording this extra information usually requires little extra effort.
Example 3.6 (Analysis) An experimental study (Schröder et al. 2015) compared nitrogen (N) and phosphorus (P) concentrations in maize, for evenly-injected liquid manure and band-injected liquid manure.
As potential confounding variables, the researchers also recorded the average temperature and the precipitation (between May 1 and September 30) at each site.7.2.4 Random allocation
One way to minimise confounding is to random allocate individuals in the study to the treatment groups. The advantage of random allocation is that it should approximately evenly distribute potential confounding variables that have been identified (such as age) but also those variables that may not have even been considered as confounders, or are hard to measure or observe (such as genetic conditions).
In the Himalaya study, the units of analysis (the people in the sample) could be allocated to a group at random, and then the groups allocated a diet through a toss of a coin (Fig. 7.2).
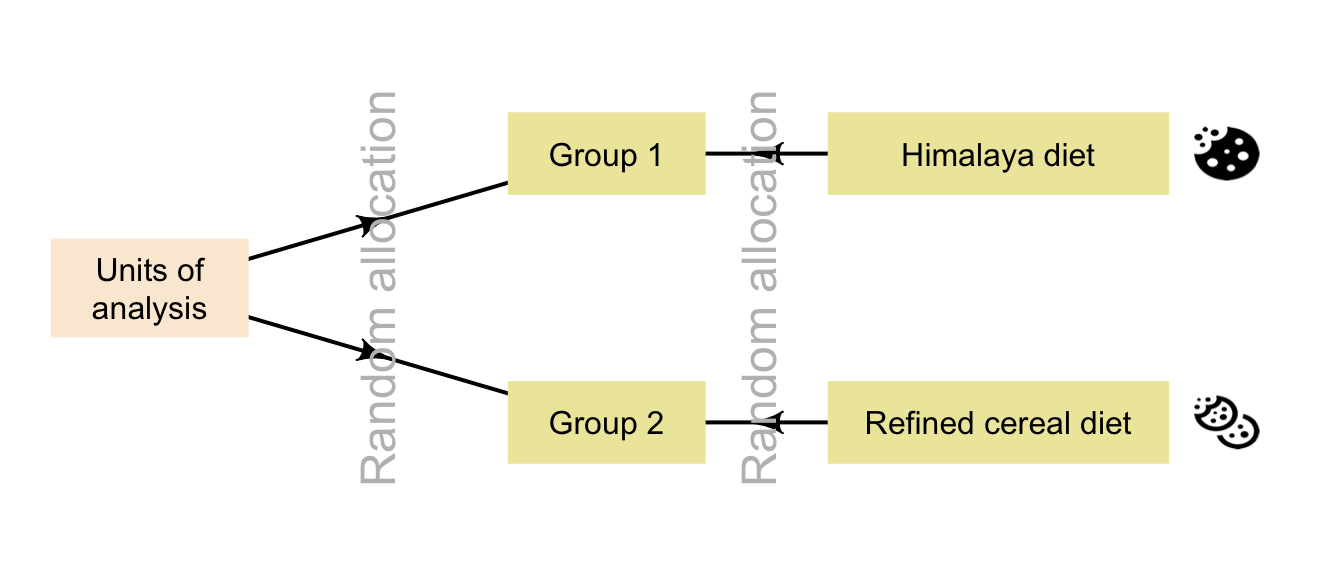
FIGURE 7.2: Random allocation can occur in two places for the Himalaya study
Random allocation may occur when randomly allocating individuals to groups (true experiment), and/or when randomly allocating treatments to groups (true or quasi-experiment). Random allocation can be shown, in general, as in Fig. 7.3.
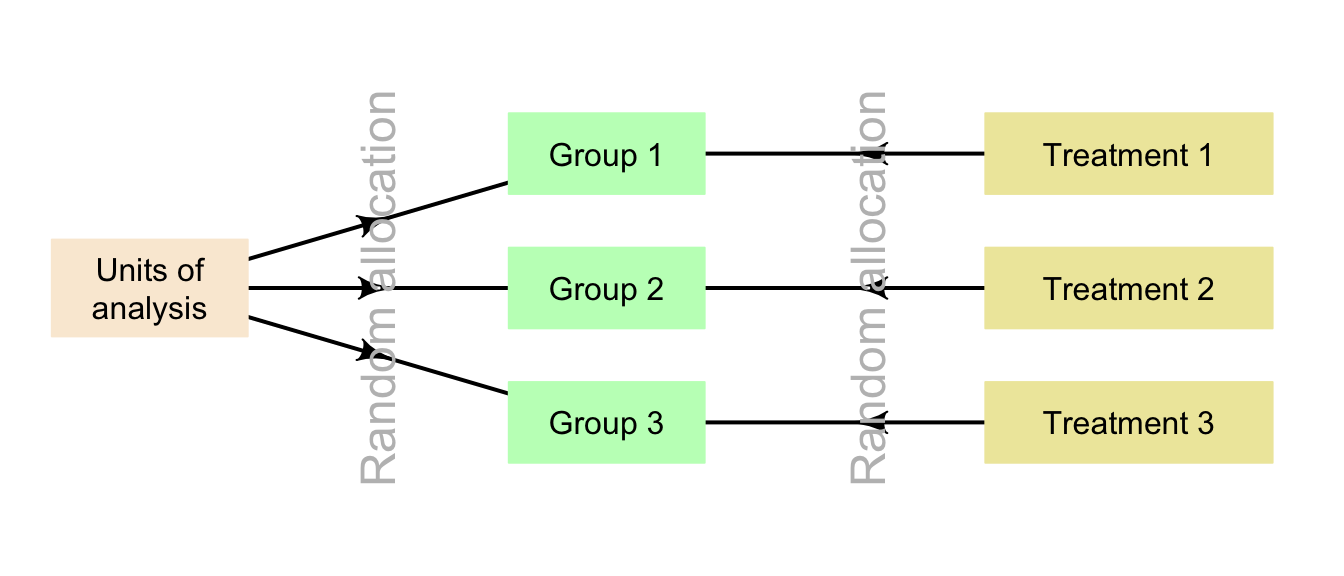
FIGURE 7.3: Random allocation in general