31.9 Example: B12 deficiency
A study in New Zealand (Gammon et al. 2012) asked:
Among a certain group of women, are the odds of being vitamin B12 deficient different for women on a vegetarian diet compared to women on a non-vegetarian diet?
The population was ‘predominantly overweight/obese women of South Asian origin living in Auckland.’ The RQ could be worded in terms of odds ratios or proportions, too.
To test the claim, the hypotheses are:
- \(H_0\): \(\text{population odds for vegetarians} = \text{population odds for non-vegetarians}\): The odds of B12 deficiency are the same in both groups.
- \(H_1\): \(\text{population odds for vegetarians} \ne \text{population odds for non-vegetarians}\): The odds of B12 deficiency are not the same in both groups.
The parameter is the population OR, comparing the odds of being B12 deficient, for vegetarians to non-vegetarians.
Here, the odds refer to the odds of a woman being B12 deficient. As with the RQ, the hypotheses could be worded in terms of odds ratios, proportions (or percentages), or relationships.
The data are shown in Table 31.7, and the numerical summary in Table 31.8. Since the RQ is about odds, a side-by-side bar chart is produced (Fig. 31.6) as the graphical summary.
| B12 deficient | Not B12 deficient | Total | |
|---|---|---|---|
| Vegetarians | 8 | 26 | 34 |
| Non-vegetarians | 8 | 82 | 90 |
| Total | 16 | 108 | 124 |
| Odds B12 deficient | Percentage B12 deficient | Sample size | |
|---|---|---|---|
| Vegetarians: | 0.3077 | 23.5% | 34 |
| Non-vegetarians: | 0.0976 | 8.9% | 90 |
| Odds ratio: | 3.15 |
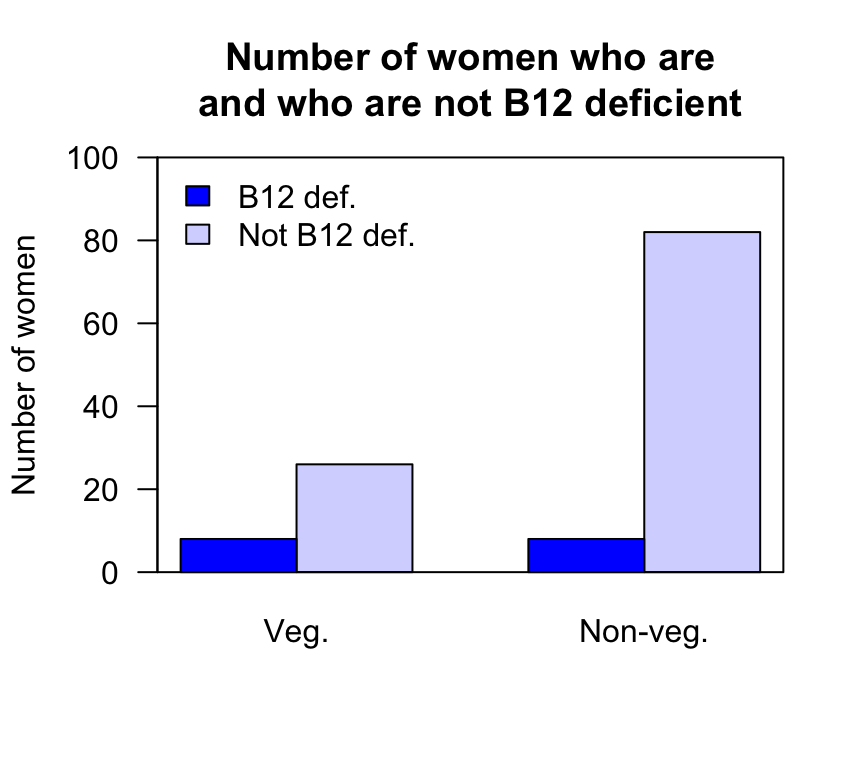
FIGURE 31.6: A side-by-side barchart comparing the number of women B12 deficient
The software output (jamovi: Fig. 31.7; SPSS: Fig. 31.8) shows that the OR (and 95% CI) is \(3.154\) (\(1.077\) to \(9.238\)). The chi-square value is \(4.707\), approximately equivalent to \(z\)-score of
\[ \sqrt{\frac{4.707}{1}} = 2.17; \] a small \(P\)-value is expected using the 68–95–99.7 rule. The software output shows that the two-tailed \(P\)-value is \(0.030\), which is indeed ‘small.’
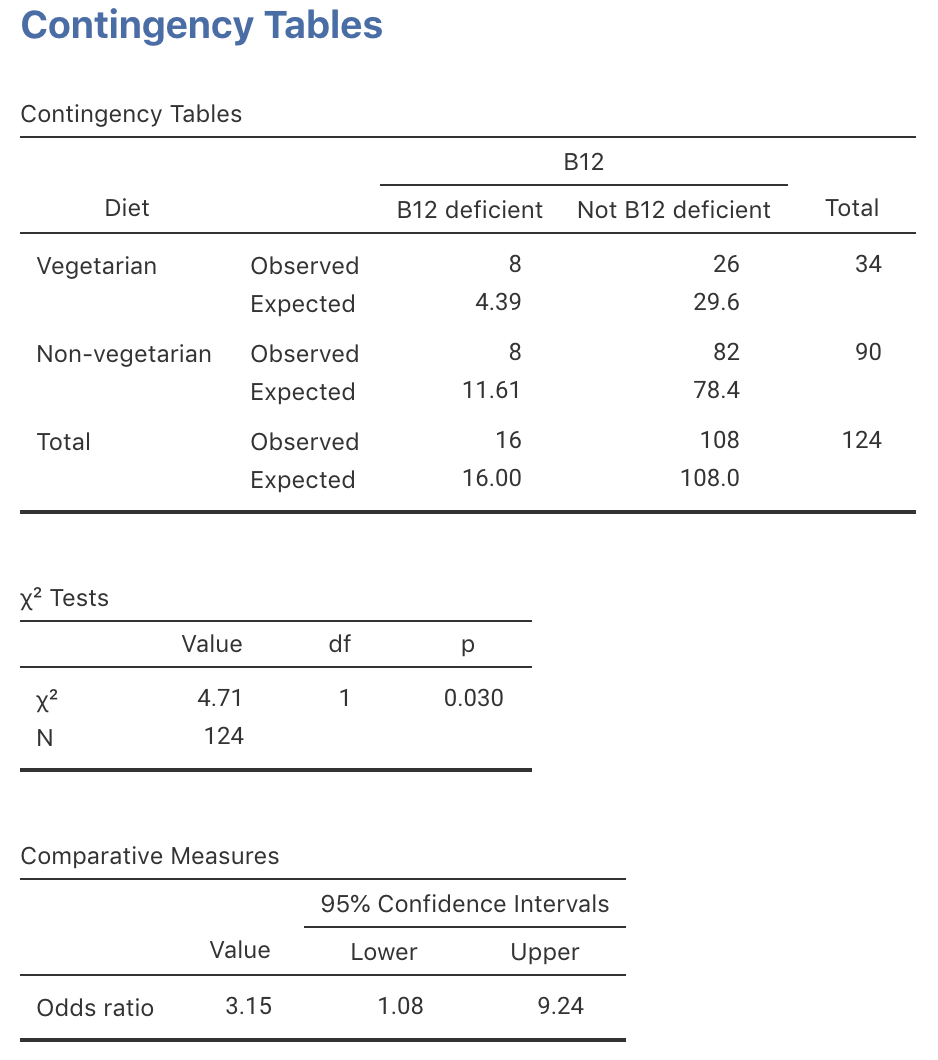
FIGURE 31.7: jamovi output for the B12 data
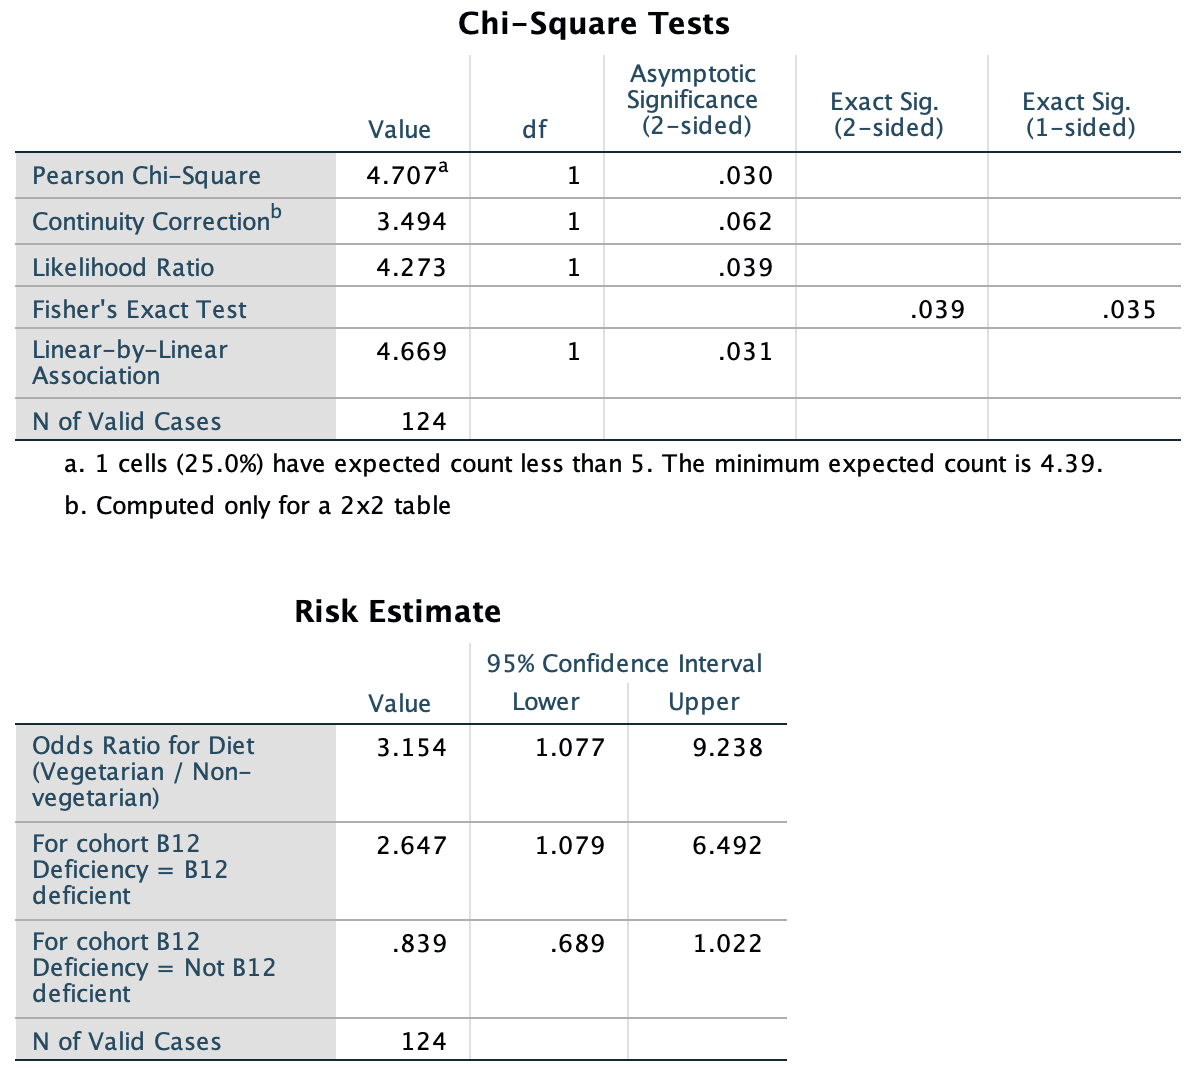
FIGURE 31.8: SPSS output for the B12 data
We conclude:
The sample provides moderate evidence (\(\chi^2 = 4.707\); \(P=0.030\)) that the odds in the population of being vitamin B12 deficient is different for vegetarian women (odds: 0.3077) compared to non-vegetarian women (odds: 0.0976; OR: \(3.2\); 95% CI: \(1.1\) to \(9.2\)).
The statistically valid shoud be checked. The jamovi output (Fig. 31.7) shows that the smallest expected count is 4.39. Likewise, the text under the first table of SPSS output in Fig. 31.8 says that
1 cells (25.0%) have expected count less than 5. The minimum expected count is 4.39.
The smallest expected count is smaller than five, so the results may be statistically invalid. Nonetheless, only one cell has an expected count less than five, and only just under 5, so we shouldn’t be too concerned (but it should be noted).