G Glossary
- 68–95–99.7 rule
- For any bell-shaped distribution, approximately 68% of observations lie within one standard deviation of the mean, 95% of observations lie within two standard deviations of the mean, and 99.7% of observations lie within three standard deviations of the mean. Also called the empirical rule.
- Accuracy
- Accuracy refers to how close a sample estimate is to the population value, on average.
- Alternative hypothesis
- The alternative hypothesis proposes that any difference, change or relationship observed in the sample is because a difference, change or relationship exists the population (that is, the difference, change or relationship cannot be explained by sampling variation).
- Bell-shaped distributions
- See Normal distributions.
- Bias
- Bias is the tendency of a sample to over- or under-estimate a population quantity.
- Blinding
- Blinding when
those involved in the study
do not know which comparison group the study individuals are in.
A study can blind the researcher to knowing what comparison group the study individuals are in.
A study can blind the participants to knowing what comparison group they are in.
A study can blind the analysts to knowing what comparison group the individuals are in during analysis. - Blocking
- Blocking is when units of analysis are arranged in groups (called blocks) that are similar to one another.
- Carryover effect
- The carry-over effect is when the effects of one treatment carry over into the effects of the next treatment, for experimental studies (Sect. 7.4.1) or observational studies (Sect. 8.3.1).
- Categorical data
- Cateogorical data is not mathematically numerical data: it consists of categories or labels (even if those labels are numbers). In this book, categorical data is called qualitative data.
- Cheating
- We give the USC definition of cheating19: Cheating is acting dishonestly to gain an unfair advantage. At university, cheating may occur in exams, lab tests and other forms of assessment.
- Classical approach to probability
- In the classical approach to probability, the probability of an event occurring is the number of elements of the sample space included in the event, divided by the total number of elements in the sample space, when all outcomes are equally likely.
- Cluster sampling
- A sample where the population is split into a large number of small groups called clusters, then a simple random sample of clusters is selected and every member of the chosen small groups is part of the sample.
- Collusion
- We give the USC definition of collusion20: Collusion involves two or more people producing work for which one person will claim ownership. At university, collusion happens if you give or receive help in completing any form of individual assessment such as assignments and exams.
- Comparison
- The comparison in the RQ identifies the small number of distinct subsets of the population between which the outcome is being compared.
- Conceptual definition
- A conceptual definition articulates what exactly is to be measured or observed in a study.
- Confidence interval
- A confidence interval is an interval in which the population parameter
is likely to be contained,
if we found many samples the same way.
If we computed the 95% confidence interval (or CI) from each sample, about 95% of the CIs would contain the statistic of interest. This interval is called a confidence interval.
Alternatively, the CI can be seen as the range of plausible values for the parameter that may have produced the observed sample statistic. We studied CIs is some specific situations (there are hundreds more!):
- CIs for one proportion: Chap. 20
- CIs for one mean: Chap. 22
- CIs for a mean difference (paired sample mean): Chap. 23
- CIs for the difference between two means: Chap. 24
- CIs for comparing two odds: Chap. 25
- CIs for regression parameters: Sect. 35.7
- Confounding
- Confounding is when a third variable influences the relationship between the response and explanatory variable.
- Confounding variable
- A confounding variable (or a confounder) is an extraneous variable associated with the response and explanatory variables.
- Conditions
- The conditions of interest that those in the observational study can be exposed to.
- Connection
- The connection in the RQ identifies another quantity of interest that varies, that may be related to the outcome.
- Continuous data
- Continuous quantitative data has (at least in theory) an infinite number of possible values between any two given values.
- Control
- A control is a unit of analysis without the treatment applied (but as similar as possible in every other way to other units of analysis).
- Convenience sample
- A sample where individuals are selected because they are convenient for the researcher.
- Data
- Data refers items of information obtained from a study (such as height of seedlings, or the type of medication given).
- Data set
- A data set refers to a collection of data from a study.
- Descriptive study
- A descriptive study is one where the researchers only focus on collecting, measuring, assessing or describing an outcome in the population.
- Discrete data
- Discrete quantitative data has a countable number of possible values between any two given values of the variable.
- Ecological validity
- A study is ecologically valid if the study methods, materials and context approximate the real situation being studied.
- Event
- An event is any combination of the elements in the sample space.
- Exclusion criteria
- Exclusion criteria are characteristics that disqualify potential individuals from being included in the study.
- Empirical rule
- For any bell-shaped distribution, approximately 68% of observations lie within one standard deviation of the mean, 95% of observations lie within two standard deviations of the mean, and 99.7% of observations lie within three standard deviations of the mean. Also called the 68–95–99.7 rule.
- Experiment
- In an experimental study (or an experiment), the researchers intervene to control the values of the explanatory variables (C) that are applied to the individuals. The researchers allocate treatments (i.e., apply the intervention).
- Experimenter effect
- The experimenter effect is another name for the observer effect in experimental studies (that is, when the researchers unintentionally influence the behaviour of subjects).
- Explanatory variable
- An explanatory variable is a variable of interest from the individuals in the study which (potentially) causes changes in, or is related to, the response variable.
- External validity
- Externally validity refers to the ability to generalise the results to other groups in the population apart from the sample studied.
- Extraneous variable
- An extraneous variable is any variable that is (potentially) associated with the response variable, but is not one the explanatory variable.
- Extrapolation
- Extrapolation refers to making prediction outside the range of the available data. Extrapolation beyond the data can lead to nonsense predictions.
- Fraud
- We give the USC definition of fraud21: Fraud can occur by:
- taking an exam for another student or letting someone take an exam for you
- falsifying research data and findings
- altering or fabricating information
- forging a document
- falsifying past academic records or employment details in order to gain entrance into the university
- Hawthorne effect
- The Hawthorne effect is the tendency of people (or animals, or…) to behave differently if they know (or think) they are being observed, in experimental studies (Sect. 7.4.2) or observational studies (Sect. 8.3.2).
- Hypothesis
- A hypothesis is a possible answer to a (research) question. More specifically, see null hypothesis or alternative hypothesis
- Hypothesis test
- A hypothesis test is a way to formally answer questions about a population, based on information obtained from a sample. In this book, we have looked at some specific hypothesis tests (hundreds exist: Kanji (2006)!):
- Hypothesis tests about a single mean: Chap. 27
- Hypothesis tests about a mean difference (means of paired samples): Chap. 29
- Hypothesis tests comparing two means: Chap. 30
- Hypothesis tests comparing odds (or percentages): Chap. 31
- Hypothesis tests about a correlation: Sect. 34.4
- Hypothesis tests about regression parameters: Sect. 35.6
- Inclusion criteria
- Inclusion criteria are characteristics that individuals must meet explicitly to be included in the study.
- Independence
- Two events are independent if the probability of one event doesn’t change depending on whether or not other event has happened.
- Internal validity
- Internally valid refers to the strength of the inferences that can be made from the sample under study.
- Intervention
- An intervention is a comparison or connection that the researchers impose upon those in the study, intending to change the outcome.
- IQR
- The IQR is the range in which the middle 50% of the data lie; the difference between the third and the first quartiles.
- IQR rule for identifying outliers
- The IQR rule can identify outliers as either:
- mild (observations \(1.5\times \text{IQR}\) more unusual than \(Q_1\) or \(Q_3\)), or
- extreme (observations \(3\times\text{IQR}\) more unusual than \(Q_1\) or \(Q_3\)).
- Judgement sample
- A sample where individuals are selected, based on the researchers’ judgement, depending on whether the researcher thinks they are likely to be agreeable or helpful.
- Levels of a qualitative variable
- The levels (or the values) of a qualitative variable refer to the names of the distinct categories.
- Lurking variable
- A lurking variable is an extraneous variable associated with the response and explanatory variables (that is, is a confounding variable), but whose values are not measured, assessed, described or recorded in the study.
- Mean
- The mean is one way to measure the ‘average’ value of quantitative data. The arithmetic mean can be considered as the ‘balance point’ of the data, or the value such that the positive and negative distances from the mean add to zero.
- Median
- The median is one way to measure the ‘average’ value of some data. The median is a value such that half the values are larger than the median, and half the values are smaller than the median.
- Multistage sampling
- A sample where large groups are selected using a simple random sample, then smaller groups within those large groups are selected using a simple random sample. The simple randomly sampling can continue for as many levels as necessary.
- Normal distribution
- A normal distribution is symmetrical distribution, with most values in the centre of the distribution. The normal distribution is described by its mean and standard deviation. A picture of a normal distribution is shown in Fig. G.1. Normal distributions are also called bell-shaped distributions.
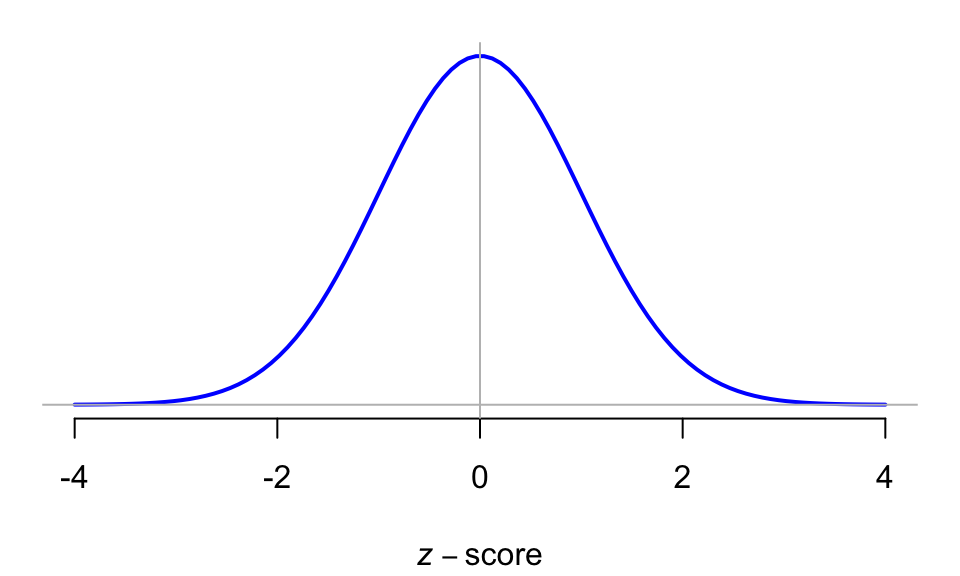
FIGURE G.1: A normal distribution
- Null hypothesis
- The null hypothesis proposes that any difference, change or relationship observed in the sample can be explained by sampling variation (that is, no difference, change or relationship exists the population).
- Observational study
- An observational study is one where the researchers do not impose the comparison or connection upon those in the study to (potentially) change the response of the participants.
- Observer effect
- The observer effect is when the researchers unintentionally influence the behaviour of subjects, in experimental studies (Sect. 7.4.4) or observational studies (Sect. 7.4.4).
- Odds
- The odds of some event is the proportion (or percentage, or number) of times that an event happens, divided by the proportion (or percentage, or number) of times that the event does not happen.
- Odds ratio
- The odds ratio is how many times greater the odds of an event are in one group, compared to the odds of the same event in another group.
- Operational definition
- An operational definition articulates how to capture (identify, create, measure, assess etc.) the value.
- Outcome
- The outcome in a RQ is the result, output, consequence or effect of interest in a study, numerically summarising the entire population (or subsets of the population).
- \(P\)-value
- A \(P\)-value is the likelihood of observing the sample results (or something even more extreme) over repeated sampling, under the assumption that the null hypothesis about the population is true.
- Parameter
- A parameter is a number describing some feature of a population, and is usually estimated by a statistic.
- Paired data
- Paired data is when two observations about the same variable are recorded for each unit of analysis.
- Percentage
- A percentage is a proportion, multiplied by 100. Percentages are numbers between 0% and 100%.
- Percentiles
- The \(p\)th percentile of the data is a value separating the smallest \(p\)% of the data from the rest.
- Placebo
- A placebo is a treatment with no intended effect or active ingredient.
- Placebo effect
- The placebo effect is when individuals report perceived or actual effects without having received the treatment or condition, in experimental studies (Sect. 8.3.3) or observational studies (Sect. 8.3.3).
- Plagiarism
- We give the USC definition of plagiarism22: Plagiarism occurs when a student uses—without acknowledging—the work of other people. In a sense, plagiarism is a form of intellectual theft in which ideas, words, information or images are taken without attribution. Plagiarism can be deliberate or accidental:
- Deliberate—for instance, if a student intentionally copies the work of others and pretends it is their own work.
- Accidental—for instance, if a student has poor notetaking skills or doesn’t know how to reference correctly, and they inadvertently present someone else’s ideas and words as their own.
- Population
- The population is the group of individuals (or cases, or subjects if the individuals are people) from which the total set of observations of interest could be made, and to which the results will (hopefully) generalise.
- Precision
- Precision refers to how likely it is that the sample values will be similar or close together, and not vary much from sample to sample.
- Proportion
- A proportion is a fraction out of a total. Proportions are numbers between 0 and 1.
- Protocol
- A protocol is a predefined procedure detailing the design and implementation of studies, and for data collection.
- Qualitative data
- Qualitative data is not mathematically numerical data: it consists of categories or labels (even if those labels are numbers). Also called categorical data.
- Quantitative data
- Quantitative data is mathematically numerical data: the numbers themselves have numerical meaning, and it makes sense to be able to perform mathematical operation on them. Most data that are counted or measured will be quantitative. Also called scale data.
- Quantitative research
- Quantitative research summarises and analyses data using numerical methods, such as producing averages and percentages.
- Quartiles
- Quartiles describe the variation and shape of data:
- The first quartile \(Q_1\): A value that separates the smallest 25% of observations from the largest 75%. The \(Q_1\) is like the median of the smaller half of the data, halfway between the minimum value and the median.
- The second quartile \(Q_2\): A value that separates the smallest 50% of observations from the largest 50%. (This is the median.)
- The third quartile \(Q_3\): The value that separates the smallest 75% of observations from the largest 25%. The \(Q_3\) is like the median of the larger half of the data, halfway between the median and the maximum value.
- Quasi-experiment
- In a quasi-experiment, the researchers (a) allocate treatments to groups of individuals (i.e., do not decide the values of the Comparison/Connection used), but (b) do not determine who or what is in those groups.
- Range
- The range is the maximum value minus the minimum value.
- Relative frequency approach to probability
- In the relative frequency approach to probability, the probability of an event is (approximately) the number of times the outcomes of interest has appeared in the past, divided by the number of ‘attempts’ in the past.
- Representative samples
- A representative sample is one where the individuals in the sample are not likely to be different the individuals not in the sample, at least for the variables of interest.
- Response variable
- A response variable is the variable used to measure, assess or describe the outcome on each individual in the population.
- Sample
- A sample is a subset of the population of interest which is actually studied, and from which information is collected.
- Sample space
- The sample space is a list of all possible and distinct results after administering a procedure whose result is unknown beforehand. is a list of the results after administering a procedure whose result is unknown beforehand.
- Sampling distribution
- A sampling distribution is the distribution of some sample statistic, showing how its value varies from one sample to sample.
- Sampling frame
- The sampling frame is a list of all the members of the population (the individuals, or cases, or subjects).
- Sampling variation
- Sampling variation refers to how much a sample estimate (a statistic) is likely to vary from sample to sample, because each sample is different.
- Scale data
- Scale data is mathematically numerical data: the numbers themselves have numerical meaning, and it makes sense to be able to perform mathematical operation on them. Most data that are counted or measured will be quantitative. In this book, scale data is called quantitative data.
- Simple random sample
- A sample where every possible sample of the same size has same chance of being selected.
- Standard deviation
- The standard deviation is, approximately, the average distance that observations are away from the mean.
- Standard deviation rule for identifying outliers
- For approximately symmetric distributions, any observation more than three standard deviations from the mean can be considered an outlier.
- Standard error
- A standard error is the standard deviation of all possible values of the sample estimate (from samples of a certain size). Any quantity estimated from a sample has a standard error.
- Stratified sampling
- A sample where the population is split into a small number of large (usually homogeneous) groups called strata, then cases are selected using a simple random sample from each stratum.
- Statistic
- A statistic is a number describing some feature of a sample (to estimate a population parameter).
- Statistical validity
- A result is statistically valid if the conditions for the underlying mathematical calculations and assumptions to be approximately correct are met. Every confidence interval and hypothesis test has statistical validity conditions.
- Subjective approach to probability
- In the subjective approach to probability, various factors are incorporated, perhaps subjectively, to determine the probability of an event.
- Systematic sampling
- A sample where the first case is randomly selected; then, every \(n\)th individual is selected.
- Treatments
- Treatments are the conditions of interest that those in the study can be exposed to (in the comparison/connection). In experiments, treatments are imposed by researchers.
- True experiment
- In a true experiment, the researchers (a) allocate treatments to groups of individuals (i.e., decide the values of the Comparison/Connection used), and (b) determine who or what is in those groups.
- Unit of observation
- The unit of observation is the ‘who’ or ‘what’ which are observed, from which measurements are taken and data collected.
- Unit of analysis
- The unit of analysis is the ‘who’ or ‘what’ about which generalizations and conclusions are made; the smallest independent ‘who’ or ‘what’ for which information is analysed. Units of analysis should not typically share a common underlying source.
- Unstandardizing formula
- When the \(z\)-score is known, the unstandardizing formula determines the corresponding value of the observation \(x\).
- Values of a qualitative variable
- The levels (or the values) of a qualitative variable refer to the names of the distinct categories.
- Variable
- A variable is a single aspect or characteristic associated with each of a group of individuals under consideration, that can vary from individual to individual.
- Voluntary* response (self-selecting) sample
- A sample where individuals participate if they wish to.
- \(z\)-score
- A \(z\)-score measure how many standard deviations a value is from the mean. In symbols: \[ z = \frac{x - \mu}{\sigma}, \] where \(x\) is the value, \(\mu\) is the mean of the distribution, and \(\sigma\) is the standard deviation of the distribution.
References
Kanji GK. 100 statistical tests. Sage; 2006.
From https://www.usc.edu.au/learn/student-support/academic-and-study-support/online-study-resources/academic-integrity↩︎
From https://www.usc.edu.au/learn/student-support/academic-and-study-support/online-study-resources/academic-integrity↩︎
From https://www.usc.edu.au/learn/student-support/academic-and-study-support/online-study-resources/academic-integrity↩︎
From https://www.usc.edu.au/learn/student-support/academic-and-study-support/online-study-resources/academic-integrity↩︎