2.8 Variables: From populations to individuals
RQs explore relationships in the population. The Outcome describes the population in general, and so Outcomes are often worded in terms of averages or percentages or similar. For example, consider this RQ seen above:
Among Australian teenagers with a common cold, is the average duration of cold symptoms shorter for teens given a daily dose of echinacea compared to teenagers given no medication?
This is an interventional RQ (using a comparison) about a population.
No relationship could be found with information from just two teenagers. Consider this: suppose a cold lasts for 6 days for a teenager who does take echinacea, and a cold lasts for 5 days for a teenager who does not take echinacea. Is there a difference between the cold durations in the population? We have no way of knowing: Only two teenagers were studied. To explore the relationship using teenagers in general, data from many teenagers is needed.
RQs concern numerical summaries about populations, but the data to answer the RQ come from individuals in the population. (As with the word ‘population,’ the word ‘individual’ does not only refer to people.)
Each piece of information that we gather from individuals is called a variable, because its values can vary from individual to individual.
The value of a variable can vary from one individual to the next. Examples include
- the duration of cold symptoms;
- gender;
- age;
- place of birth;
- amount of tyre wear;
- hair colour.
The RQ identifies the variables needed to answer the RQ, though other variables may be (and typically are) measured also (Sect. 6.3).

Example 2.20 (Variables) ‘Duration of cold symptoms’ is a variable, as it is obtained from individuals, and its value can vary from individual to individual.
The ‘average duration of cold symptoms’ is the outcome, numerically summarising the individuals cold durations across the population.While many variables can be measured on individuals, two variables are of greatest importance:
- The response variable measures, assesses, describes or records information to determine the outcome; and
- The explanatory variable measures, assesses, describes or records information to determine the comparison or connection (Table 2.2).
The RQ cannot be answered without information about these two variables.

|

|
|
| Population | Indivduals | |
| Outcome: | \(\rightarrow\) | Response variable |
| Comparison/Connection: | \(\rightarrow\) | Explanatory variable |
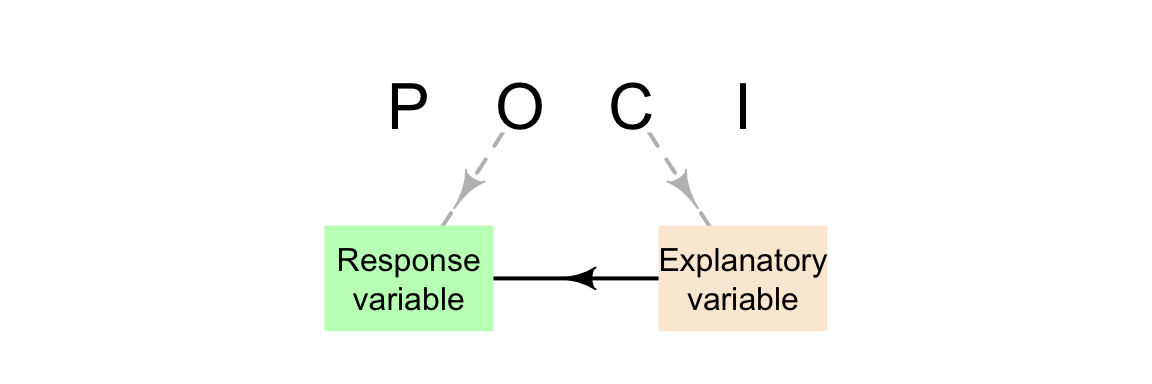
FIGURE 2.4: The POCI elements
The outcome refers to the numerical summary of the values of the response variable (Table 2.3).
|
|
\(\rightarrow\) |
|
| Population | \(\rightarrow\) | Indivduals |
| Average increase in diastolic blood pressure | \(\rightarrow\) | Increase in diastolic blood pressure of individuals() before and after exercise |
| Percentage of seedings that sprout | \(\rightarrow\) | Whether or not an individual seedling sprouts |
| Proportion owning iPad | \(\rightarrow\) | Whether or not an individual owns an iPad |
| Average cold duration | \(\rightarrow\) | Cold duration for individuals |
| Percentage of concrete cylinders having fissures | \(\rightarrow\) | Whether or not an individual cylinder has fissures |
The explanatory variable is a formal description of what C measures, observes, assesses or describes in each individual member of the population (Table 2.4).
| Comparison being made | Explanatory variable in Individuals | |
|---|---|---|
| Between males and females | \(\rightarrow\) | The sex of each person |
| Between beech, tallowwood, and jarrah floor boards | \(\rightarrow\) | Type of floorboard in each home |
| Between 350kg/ha and 400kg/ha fertilizer rates | \(\rightarrow\) | Application rate in each paddock |
| Between people in their 20s, 30s and 40s | \(\rightarrow\) | Age group for each person |
In many cases, explanatory variable occurs before the response variable, or can be thought of as ‘causing’ the response variable.
Example 2.21 (Variables) For the final RQ for the echinacea study (Sect. 2.7, response variable would be length of cold symptoms, and the explanatory variable is the type of medication (echinacea; or none).
In this case, the type of medication is taken before the cold symptoms disappear, and perhaps even causing them to disappear.Think 2.9 (Variables) Consider this RQ:
For carrots grown in Buderim, is the average weight of carrots 8 weeks after planting the same when grown without Thrive, and for carrots grown with weekly applications of Thrive?
- What is the outcome? What is the comparison?
- What data is needed from each element of the population to answer this question? That is, what are the response and explanatory variables?
Example 2.22 (Variables) Consider this RQ:
For overweight men over 60, is the average weight loss after three weeks the same for a diet high in fresh fruit and a diet high in dried fruit?
The outcome is the average weight loss; the response variable is the weight loss for each individual man. (This would be found by measuring their weight before and after three weeks on the diets.)
The comparison is between the two diets; the explanatory variable is which diet each man is on.