17.1 How efficient are different types of car?
The dataset includes vehicles over many model years. The numbers refer to the numbers of models evaluated, not the numbers of vehicles on the road, so one Rolls Royce counts the same as one Toyota Corolla. Only cars are considered here, also excluding cases with missing values and some specialist small groups. There is information on the individual cars, the fuels used, fuel consumption under different conditions, and car emissions. Only estimated average mpg (miles per gallon) figures have been used in this chapter, but the dataset contains much more detailed information.
The various types of 4-Wheel and All-Wheel Drive cars have been combined in the All-Wheel category.

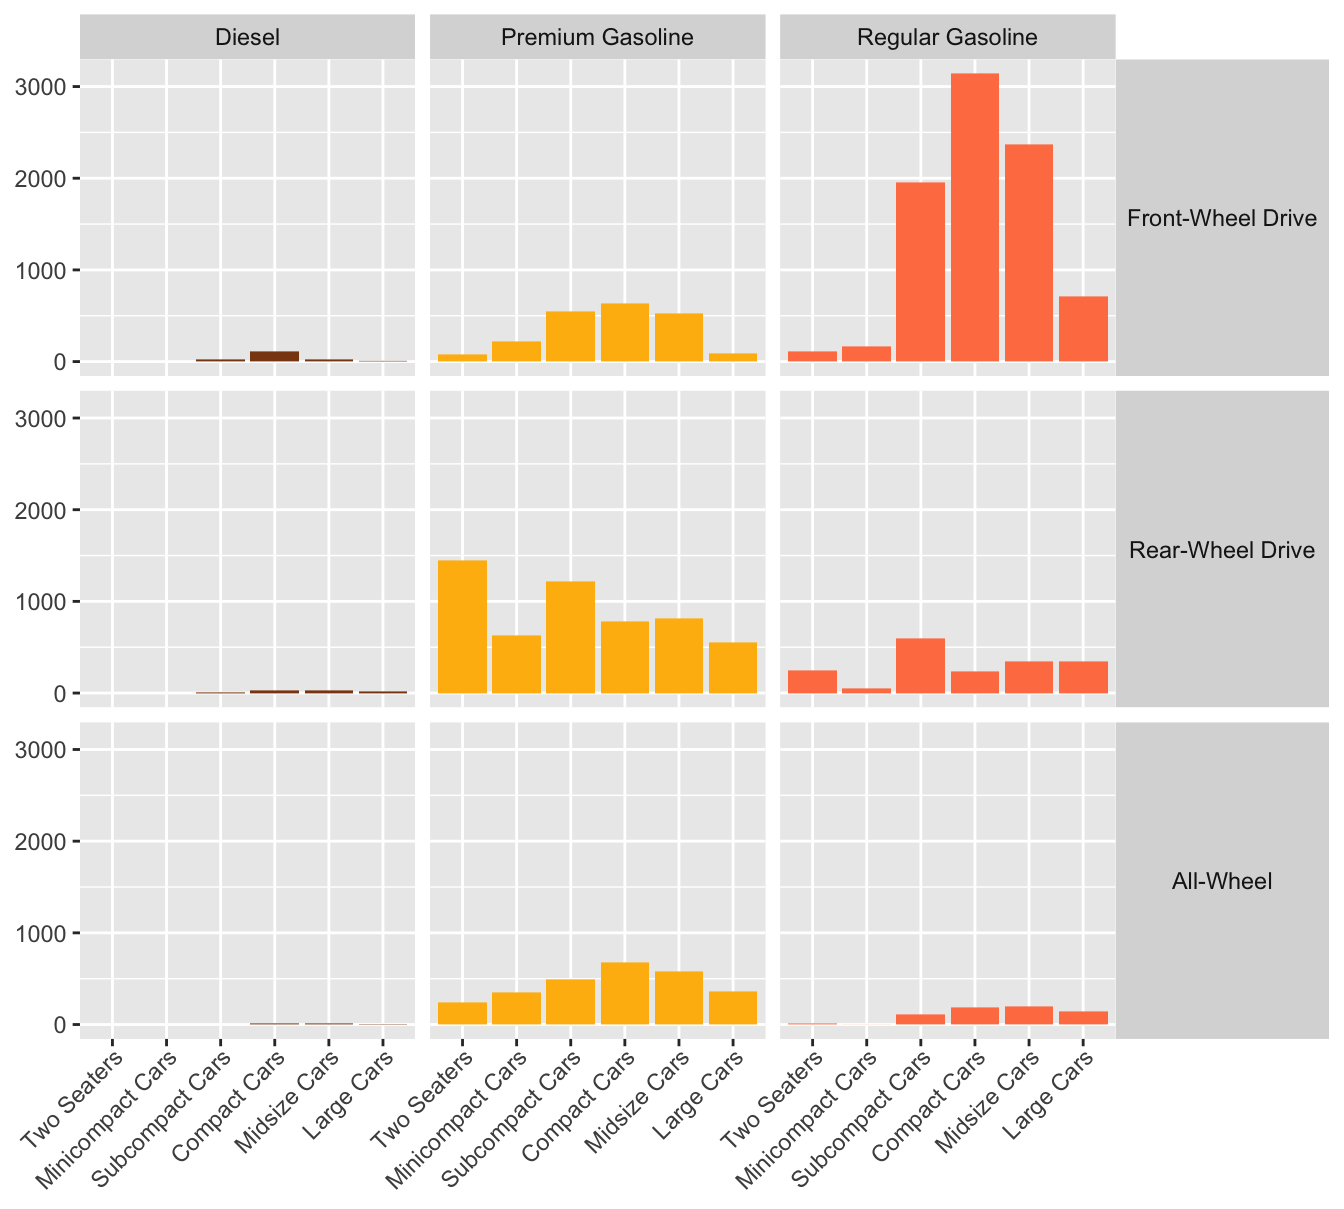
Figure 17.1: Numbers of car models tested by the U.S. Environmental Protection Agency by fuel, drive type, and class
There were relatively few diesel cars (280 out of 21443 cars in this display). Front-Wheel Drive cars used mainly regular gasoline. Rear-Wheel and All-Wheel Drive cars used mainly premium gasoline.
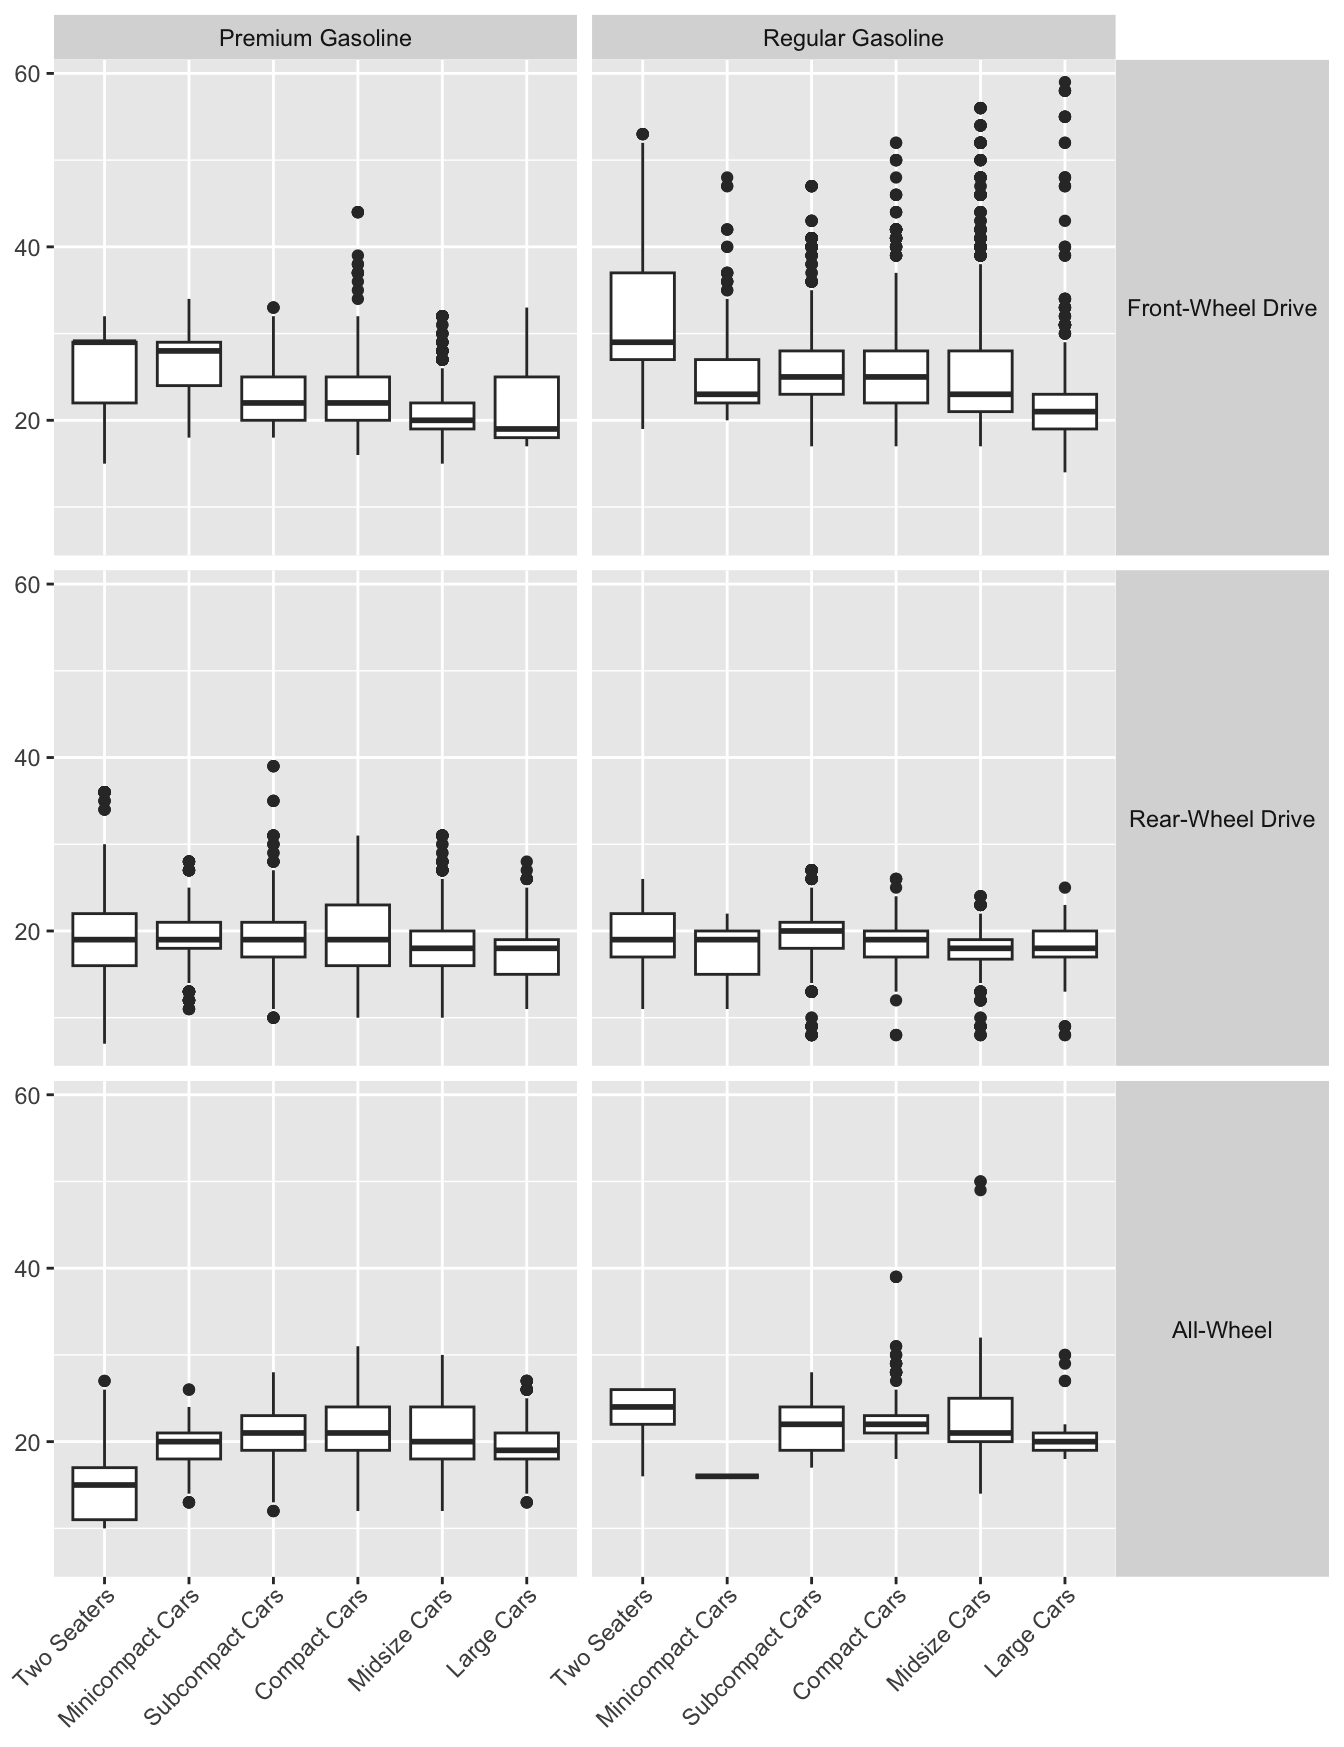
Americans (and the British) measure fuel efficiency in mpg (miles per gallon). Europeans would use an inverse measure, litres per 100 kilometres. The dataset provides two estimates of fuel efficiency, one for city driving and one for highway driving, and these are combined in an overall figure that assumes 55% of driving distance is in city conditions. There is an R package, fueleconomy, that makes the data available but only up to 2015. Figure 17.2 uses boxplots to summarise mpg data for the two gasolines. There were some high outliers amongst the Regular Gasoline cars with Front-Wheel Drive, i.e., they use far more fuel than other models in their class.

Figure 17.2: Fuel efficiency of gasoline cars by fuel, drive type, and class
Figure 17.3 shows that these were mainly hybrid cars (including plug-in hybrids) and Figure 17.4 suggests a few more were cars of model year 1998 or earlier.

Figure 17.3: Fuel efficiency of hybrid cars compared with the rest (boxplot widths are proportional to the square roots of the group sizes)

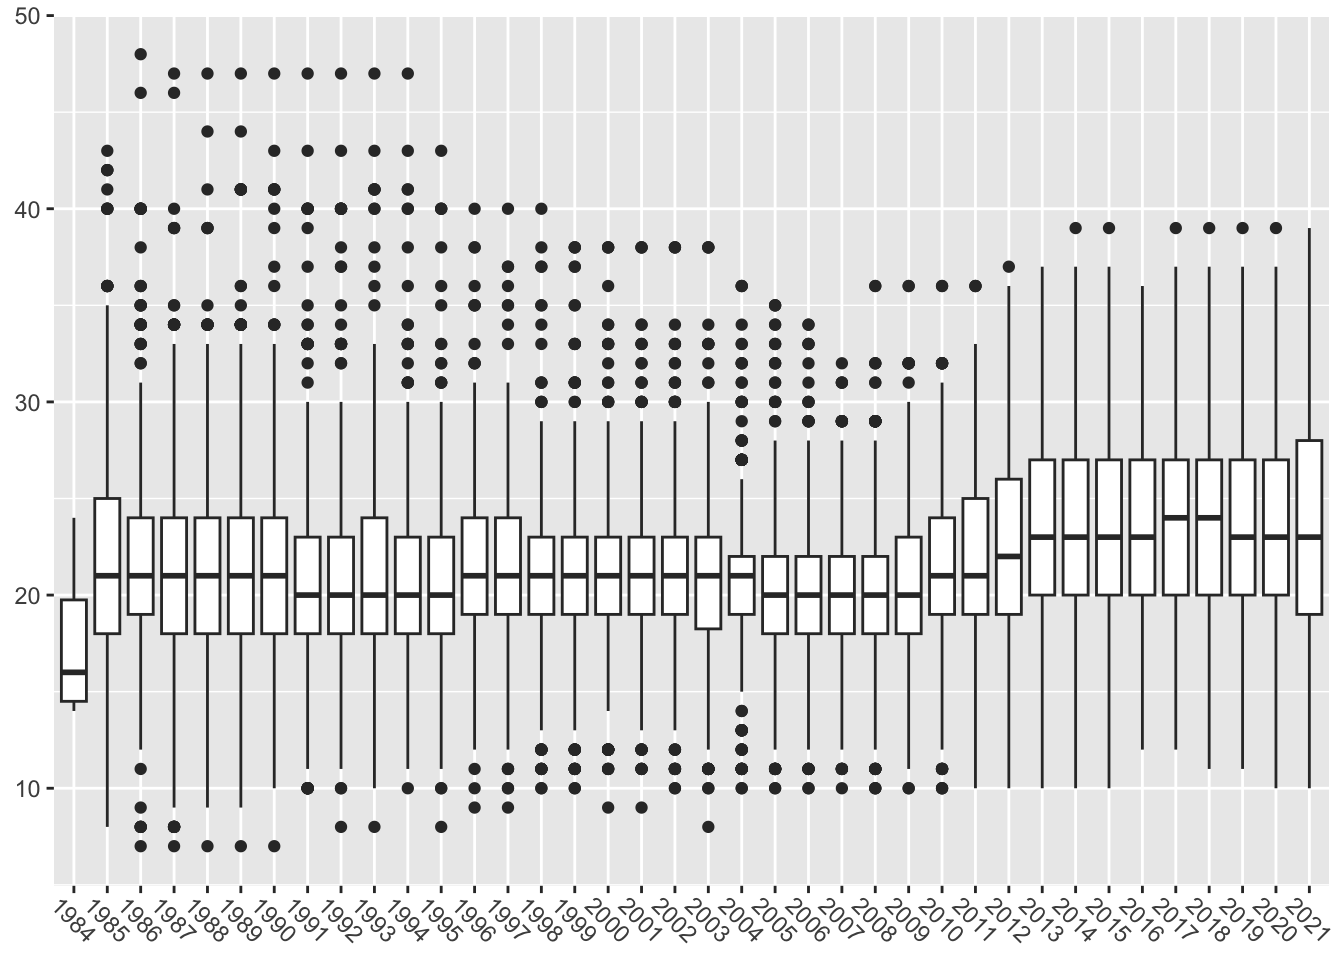
Figure 17.4: Fuel efficiency of non-hybrid cars over the years
Figure 17.4 also shows that the worst mpg values were recorded over 15 years ago or more. Testing procedures have changed over time and so like may not be being compared with like over such a long period.