6.2 How much have performances improved?
Performances in a few disciplines, such as in swimming and athletics, can be directly compared, although the continual improvements in technique, equipment, training, and support of all kinds, as well as the growing population of athletes have to be borne in mind. Rule changes can also have significant effects. Most other disciplines such as boxing, gymnastics or sailing are even harder to compare over time.
Gold Medal performances are sometimes world records, more often not. The best performance in one Olympics may not be as good as the best performances in earlier Olympics. Athletes may miss out because of injury or ill health or because their country boycotts a Games (as happened for various reasons at the Games of 1976, 1980, 1984). In the early years travel time and costs limited participation. So Olympic performances are not ideal for studying developments over time. Nevertheless, the Olympic Games offer regular simultaneous checks on performance changes in many sporting events and that has its advantages too.
There were a number of additional problems with the data. Some values were missing (e.g., several for the pole vault for men). The heptathlon and decathlon results were reported on quite different scales in different years. A few performances at some games were reported with a ‘w’ at the end signifying wind assistance. This means that there was a tail wind of more than 2 m/s, invalidating record attempts but not the result. It only applies to certain sprint races, the triple jump and long jump. Four 100 m races were affected and one complete long jump competition. Three triple jump gold medal performances were marked as wind-assisted. For jumps, it made no difference once the ‘w’ was removed. For 100 m races the times were in seconds instead of thousandths of seconds. This included times in Jesse Owens’ 100 m final at the 1936 Olympics in Berlin. There were other issues that had to be resolved. Only events that had taken place at at least six Olympics were included.
In the analysis carried out by the scrapers of the dataset the gold medal performances were standardised by calculating how much better or worse they were in percentage terms than the average of the gold medal winners over all the Games at which the event took place. For events that have been included in the Games a long time the overall average then tended to reflect a poorer performance than if results were only included from more recent games. The solution adopted here is to compare results with the average over the Olympics from 1996 to 2016.
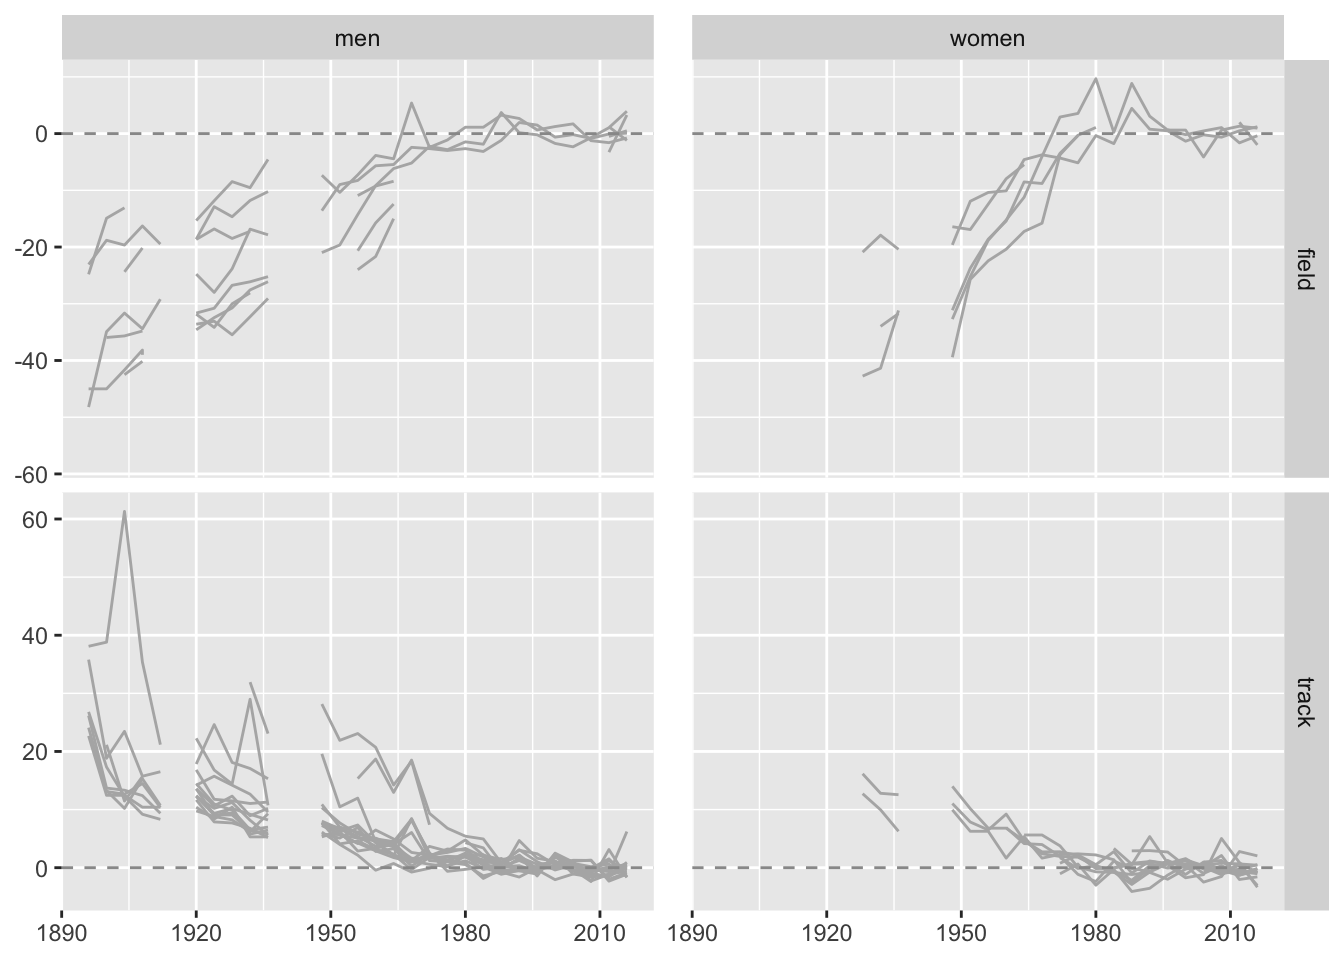
Figure 6.7 shows data for individual athletics events grouped by sex and whether they are a field event like the shot put (higher numbers are better) or a track event like the 100 m (faster times are better). The percentage differences between the gold medal performances at each Games and the averages of gold performances over the six Games from 1996 to 2016 are plotted against years to show the overall trends.

Figure 6.7: Percentage differences in gold medal performances in athletics events compared with averages over the last six Games
Scales are primarily determined by relatively weak performances at early Games and mostly there is a general improvement. Studying the graphics closely, other features are apparent. There are no early data for women, because female athletics events were first held at the 1928 Games in Amsterdam. Some events were introduced later than others. There are some odd peaks and some surprising gaps (in addition to the gaps for the two World Wars). There are many missing data points for the field events, where there should be 8 events for the men and 6 for the women for these data. The averages were calculated ignoring missings, so for three events only one value contributed to the average and for five events only two. A more refined analysis would be more reassuring, but is unlikely to make much difference to the overall impression.

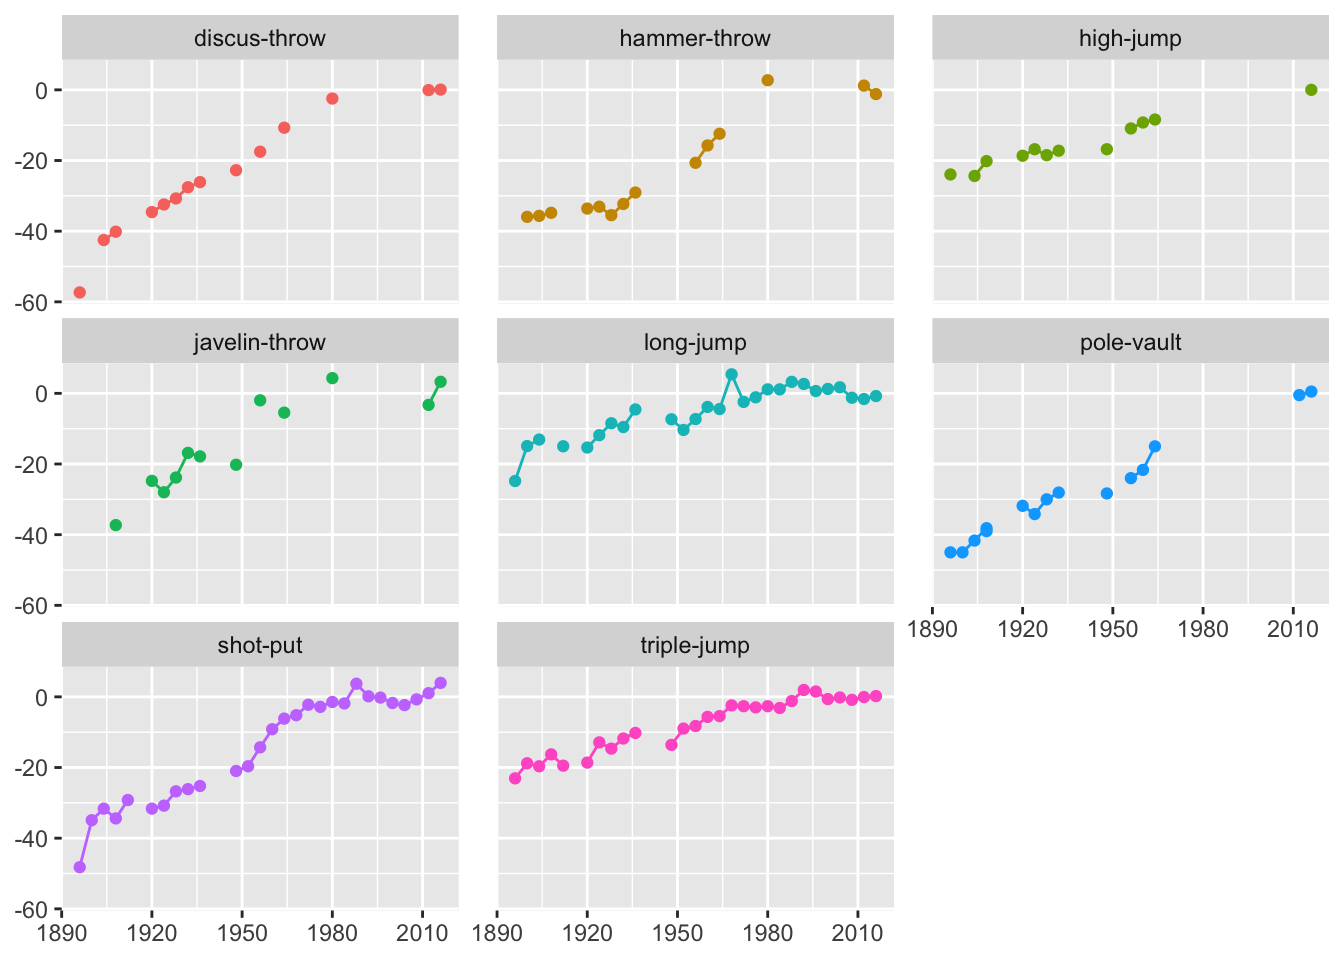
Figure 6.8: Field events for men: percentage differences in gold medal performances compared with averages over the last six Games
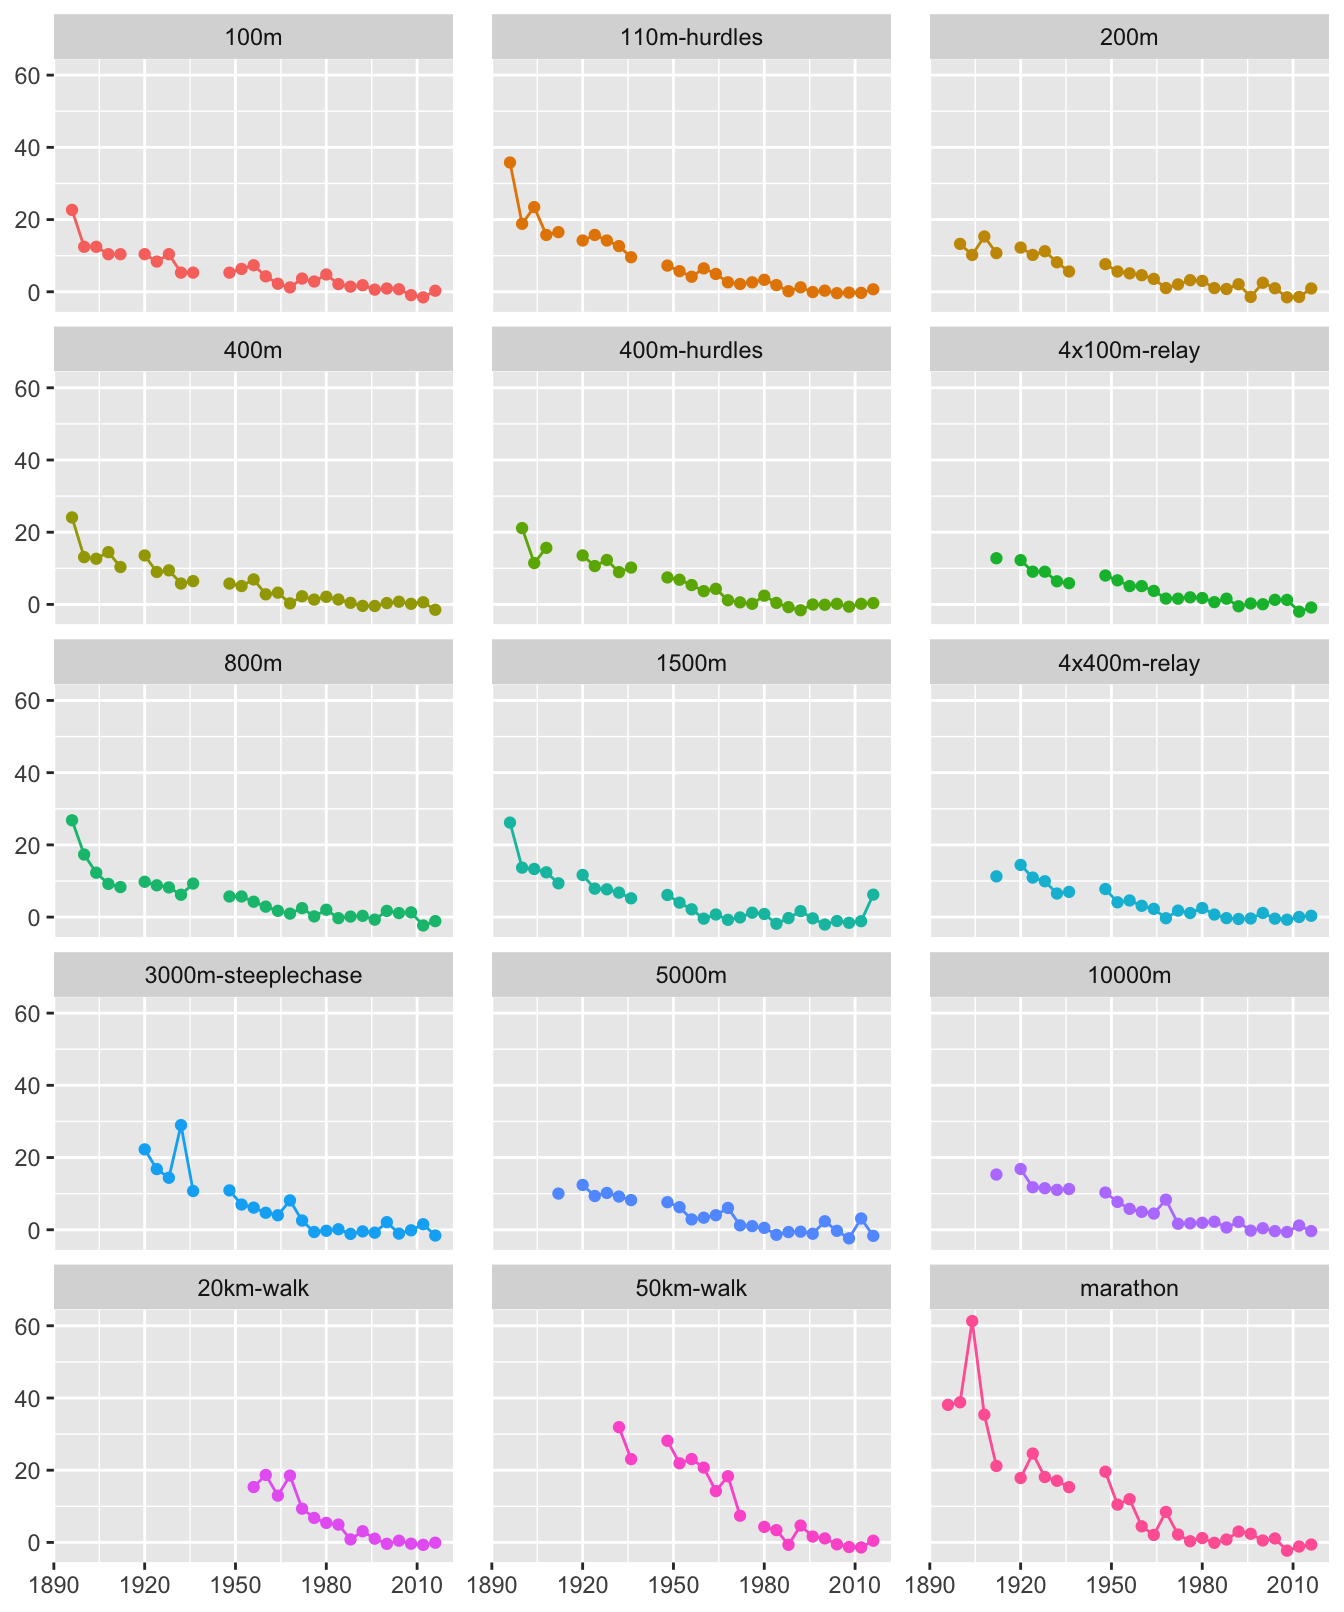
The four graphics were separately faceted by event for more details. Figures 6.8 and 6.9 show men’s track and field events. The graphics for women’s events showed similar issues, but fewer and less dramatic ones. For field events a lot of data is missing, for the pole vault and high jump in particular. These problems must have been due to failed data scraping. Early low values dominate, but the values higher than the recent averages are also worth studying. Bob Beamon’s famous long jump at Mexico City 1968 is still the Olympic record and the second longest jump of all time. The discus, hammer throw, and javelin could all be checked in more detail.

Figure 6.9: Track events for men: percentage differences in gold medal performances compared with averages over the last six Games, events are ordered by distance
The time for the 1904 marathon race in Figure 6.9 is clearly out of line. According to Abbott (2012), “the 1904 marathon was less showstopper than sideshow, a freakish spectacle” and “The outcome was so scandalous that the event was nearly abolished for good.” The time for the 3000 m steeplechase in 1932 also looks wrong. Due to an error in lap counting, the runners had to run an extra lap of the track.
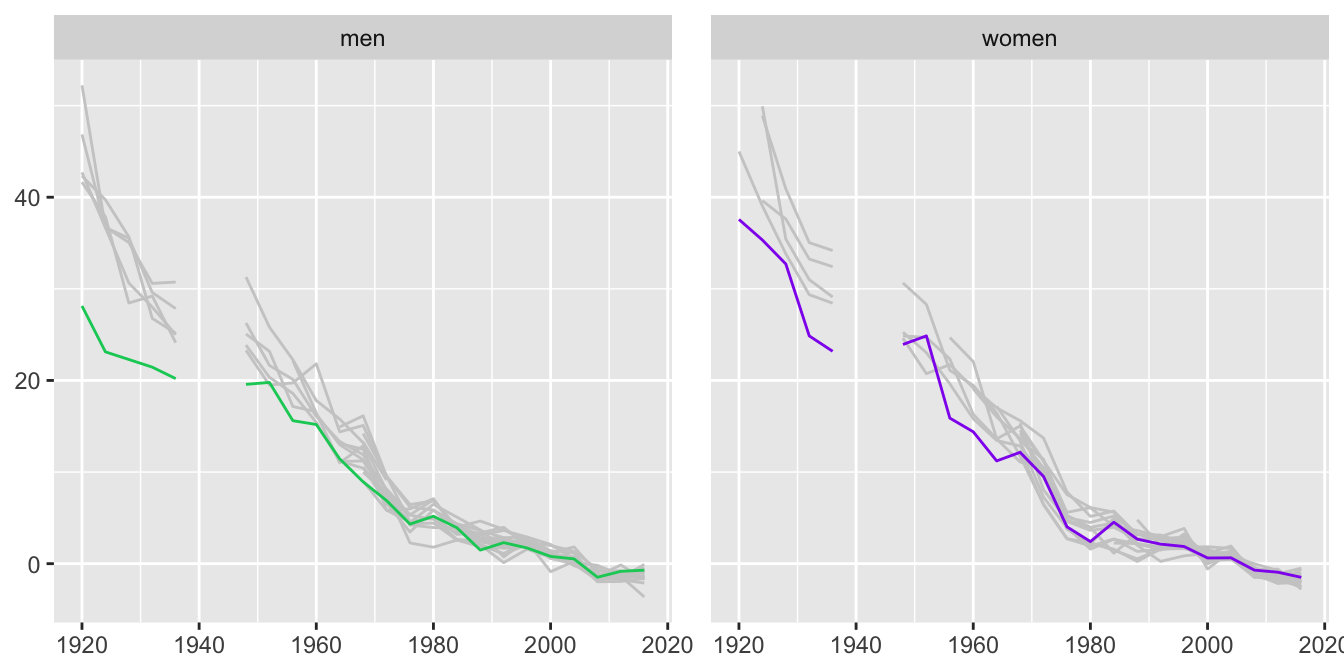
Sometimes particular events stand out. Looking at the swimming results, most have similar patterns for men and women, but one stands out in each case, interestingly the same event, the 100 m freestyle, as Figure 6.10 shows:

Figure 6.10: Percentage differences in gold medal performances in swimming events for men and women compared with averages over the last six Games since 1920 with the 100 m freestyle highlighted
Perhaps strong performances were achieved earlier for the 100 m or there have been greater relative improvements in other events. The men’s 100 m freestyle champion in 1924 and 1928 was Johnny Weissmuller who went on to play Tarzan in Hollywood movies. He won five gold medals in all (and had five wives).