24.2 What about vehicle accidents without deer?
Data are available over the same period for vehicle accidents not involving deer and these are useful for comparison purposes, in particular for studying what features of the deer-vehicle accident data are not found in the data for other accidents.
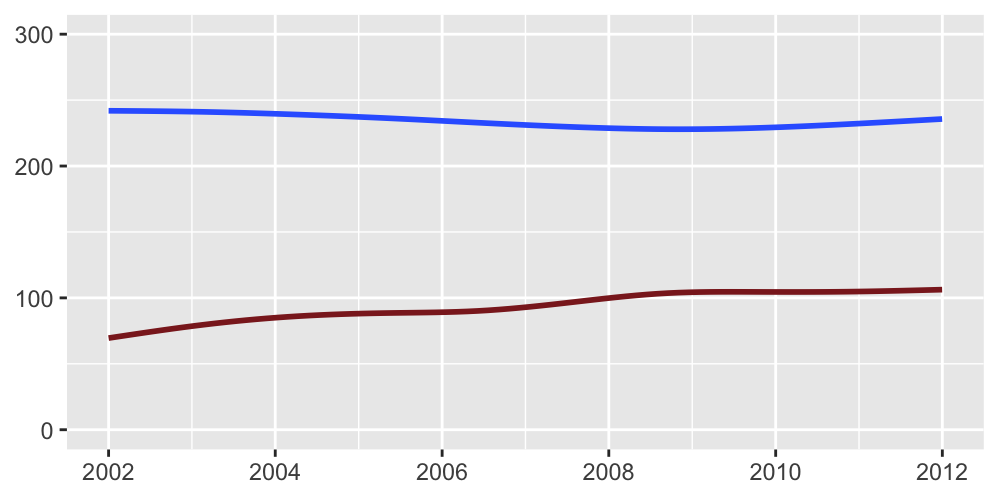
Figure 24.7 shows a smoothed version of the daily number of vehicle accidents not involving deer, together with the comparable graph for deer-vehicle accidents.

Figure 24.7: Smoothed number of non-deer-vehicle accidents (blue) and deer-vehicle accidents (brown) per day in Bavaria over ten years
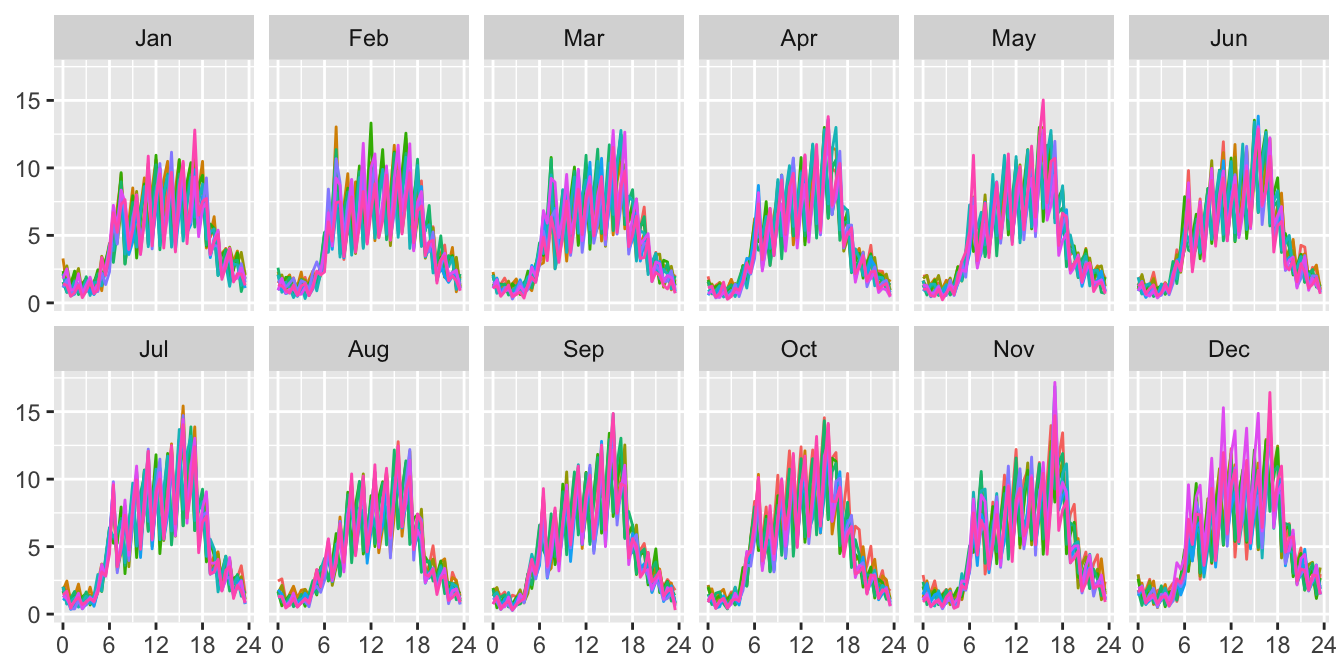
There is little change over the ten years in non-deer vehicle accidents, with a decline of around 5%. The overall level is over twice the level of accidents involving deer. Graphics similar to Figures 24.2 and 24.3 can be drawn to show that there is a little seasonality in the data, but not nearly so much as in the deer-vehicle accident data. A graphic like Figure 24.4 would show that there is not much variation through the week either, apart from fewer accidents on a Sunday. The daily pattern of non-deer accidents is shown in Figure 24.8.

Figure 24.8: Daily patterns in numbers of non-deer-vehicle accidents by month across the years
Instead of morning and evening peaks, there are higher levels through the day and lower levels in the middle of the night. Interestingly, the vertical scale is the same as that of Figure 24.6. In fact the half-hours with the highest average rates for deer accidents have slightly higher values than the half-hours with the highest average rates for accidents not involving deer, despite there being over twice as many non-deer accidents overall.
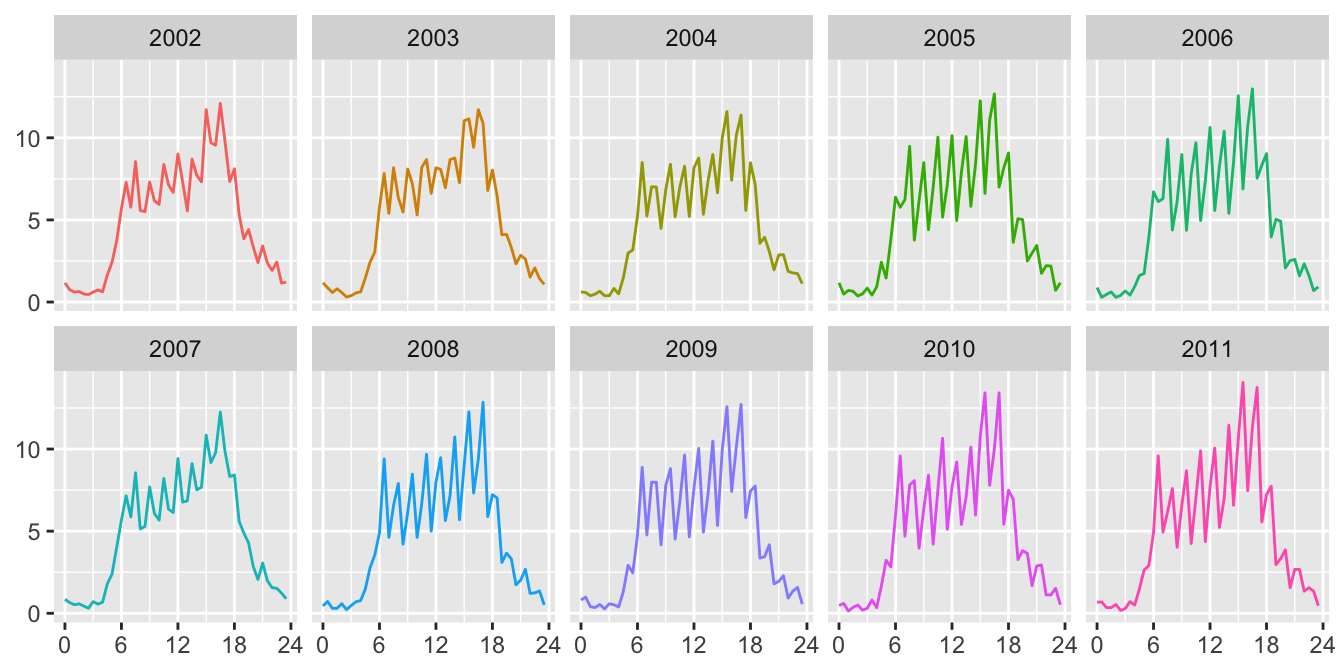
The daily plots have a sawtooth pattern that can also be seen in Figure 24.9 showing just the data for Tuesdays each year.

Figure 24.9: Daily patterns for Tuesdays in numbers of non-deer-vehicle accidents across the years
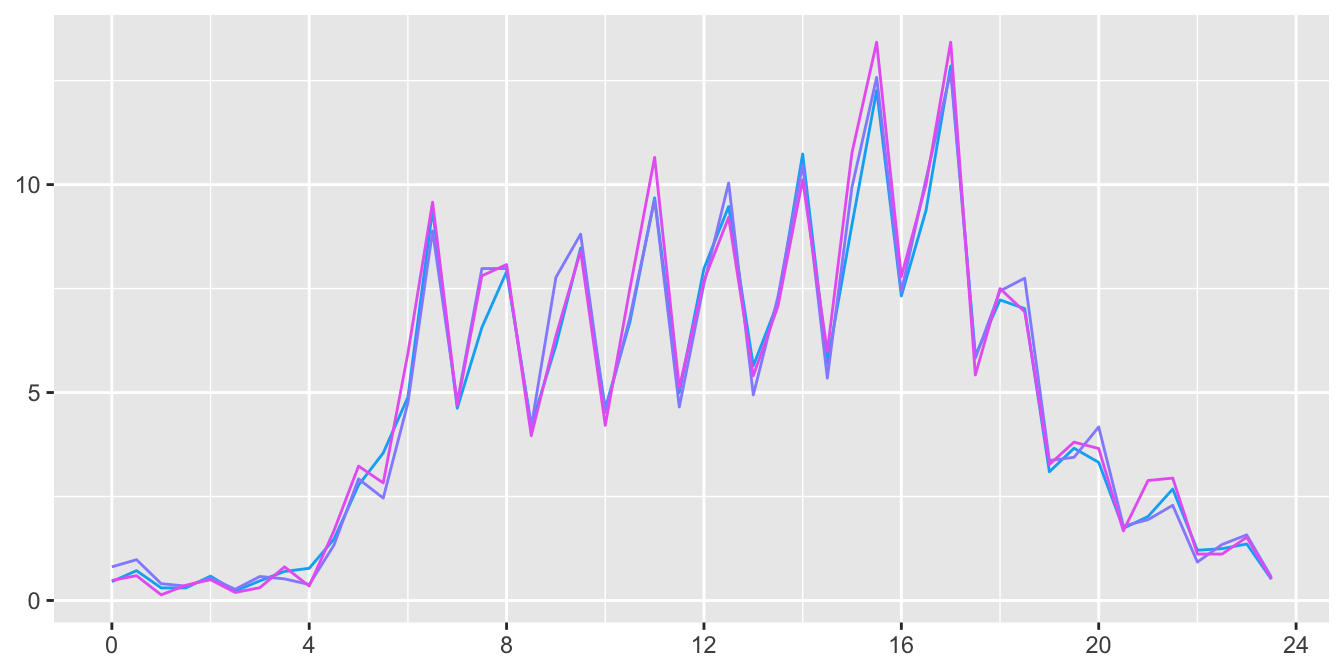
Overlaying the Tuesday data for the three years 2008, 2009, 2010 gives Figure 24.10.

Figure 24.10: Daily patterns for Tuesdays in numbers of non-deer-vehicle accidents for the years 2008, 2009, 2010
The agreement across the three years is surprisingly close. Possibly it has something to do with how the data were collected and stored.
Answers The numbers of vehicle-deer accidents in Bavaria increased over the ten years covered, while the numbers of other accidents went down slightly. There are clear seasonal, weekly, and daily patterns in vehicle-deer accidents. Drivers should be particularly careful in the months of May, June, November around sunrise and sunset.
Further questions Can reasons for the daily patterns in non-deer vehicle accidents be found?
Graphical takeaways
- Axis labels for time series can be placed in different positions for the same data. Whatever is done should be stated. (Figure 24.1)
- Smoothing picks out trends in time series. (Figure 24.3)
- The choice of faceting variable is important. (Figures 24.5 and 24.6))
- Overlaying time series is effective for checking how similar they are. (Figure 24.10)