15.3 How have countries changed?
Over sixty years much has changed in Europe. Countries have split up (like the Soviet Union and Yugoslavia) or combined (like the two Germanies). Other complications are that the four countries in the United Kingdom each have their own national team and all have reached the Euro finals at one time or another.
The dataset has four country variables: the squad name, the name of the national team (these two only differ for the Soviet Union/USSR); the name of the country of the player’s club, and an amended version (differing for the Soviet Union/USSR, Yugoslavia, and for clubs based in Wales that play in the English leagues). Three players had no club contract while playing in one of the competitions and their club details were recorded as missing.
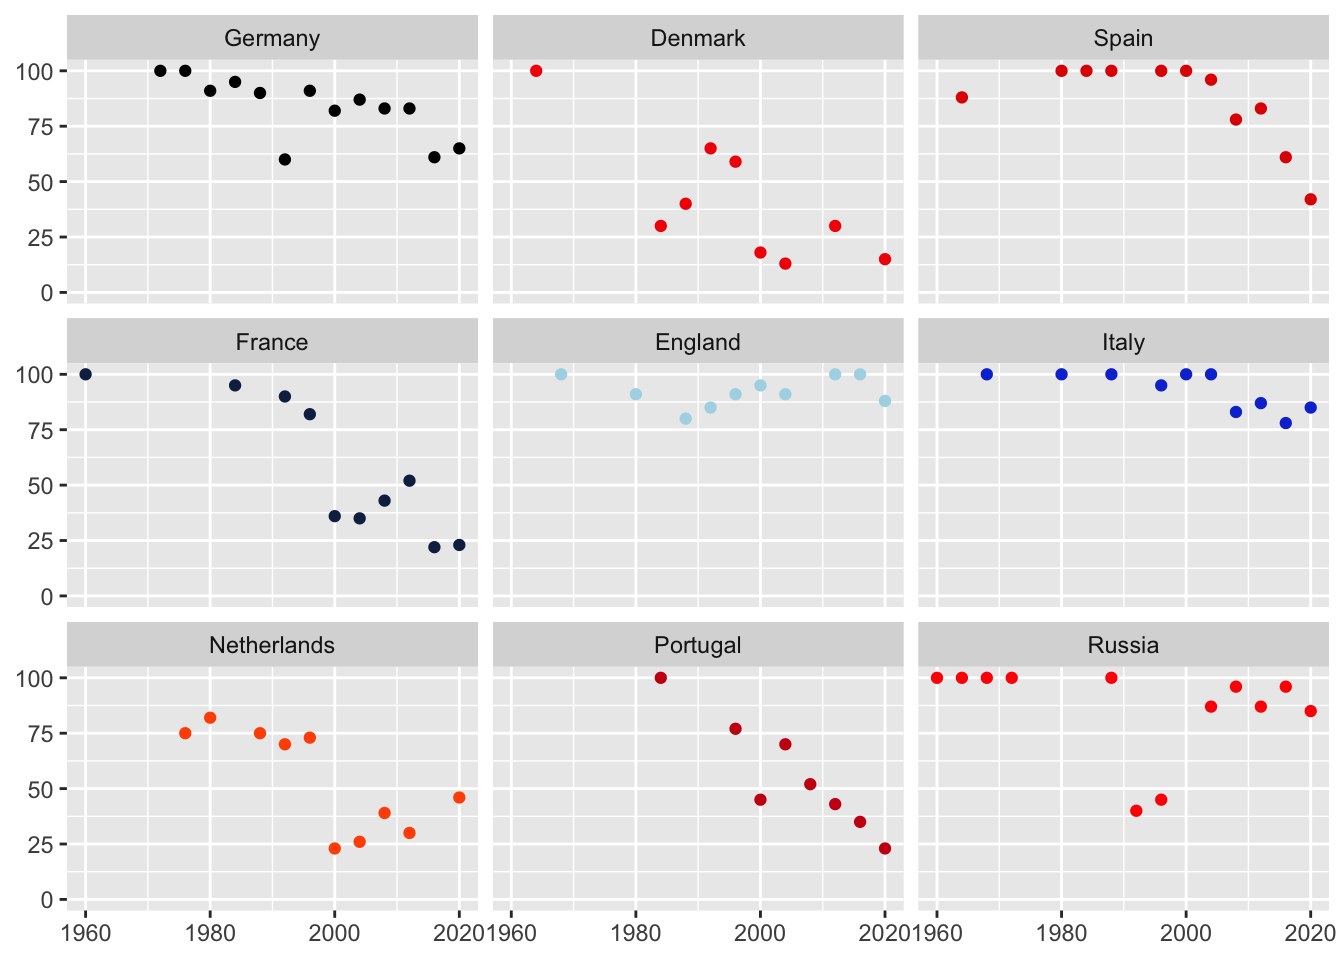
Making the strong assumptions that the Soviet Union in the early competitions is the same as Russia in the later competitions and that Germany is the same country as West Germany before unification, the percentages of home players in the teams have been plotted for the countries that qualified for at least 8 of the Euro finals in Figure 15.8.

Figure 15.8: Percentages of home players for the countries who played most often in the 16 European Championship finals
There is an interesting variety of patterns. The rate for Germany, who have played most often despite not entering the first two competitions, shows a slight decline over time. The exception was 1992 when 8 of their 20 players were playing in Italy. The finals in 1992 were also different for Russia, when 12 of their players were playing abroad, a big change from the Soviet Union days. Since 2004 they are back to a high percentage of home players, like Italy and England. Both the French and Dutch rates dropped a lot in 2000. In that competition Spain only used home players, but their rate has declined to less than 50% in the most recent competition.
There was no information included on results. One possibility to make Figure 15.2 more comparable across the years would be to restrict it to the four semi-finalists in each competition. The information was added to the dataset and the graphic drawn, but the main conclusion did not change.
Answers More and more international players play their football abroad. Just over half of the players of the 24 teams at Euro 2020 played in England, Germany, or Italy.
Further questions Which team had the biggest variability of home player percentage across the years? Are their similar patterns for teams competing in the World Cup? Is there data available on the composition of club teams by nationality?