16.5 How well have teams performed over the years?
Everyone interested in football has their own favourite team and remembers the times their team was strongest. There is also a lot of interest in local rivalries. The following graphics use league tables for every division and give teams an overall ranking for each season. The top teams come from the first tier, the next ones from the second tier, and so on. For the period when there were two third tiers, the Third Divisions North and South, the tables for the two have been interwoven and the rankings estimated accordingly.
Until 1976 teams equal on points were ranked on the ratio of the number of goals they scored to the number their opponents scored. This was called, misleadingly, goal average. From 1976 on, goal difference was used. The rankings used here reflect these rules. Goal average was introduced in 1894. Before that there was no official way of ranking teams with equal points. These tables use goal average for those years. You would think it might have been an issue as in the very first season with 12 clubs, there were three pairs on equal points. What are the chances of that? Two teams finished at the foot of the table on equal points, Notts County and Stoke City. Notts County had the better goal average and Stoke City the better goal difference. It did not matter, both—and the two teams above them—had to apply for re-election. A more dramatic example arose in 1923. Huddersfield Town won on goal average from Cardiff City who would have won on goal difference (although only because they scored one more goal, the goal differences were the same). It would have been the only occasion a team based outside England won the English League Championship.
There was one further problem. In season 2019-20 not all games were completed in the bottom two tiers because of the disruption caused by Covid. The teams did not all play the same number of games and final league positions were decided by the ratio of points won per game and then goal difference.
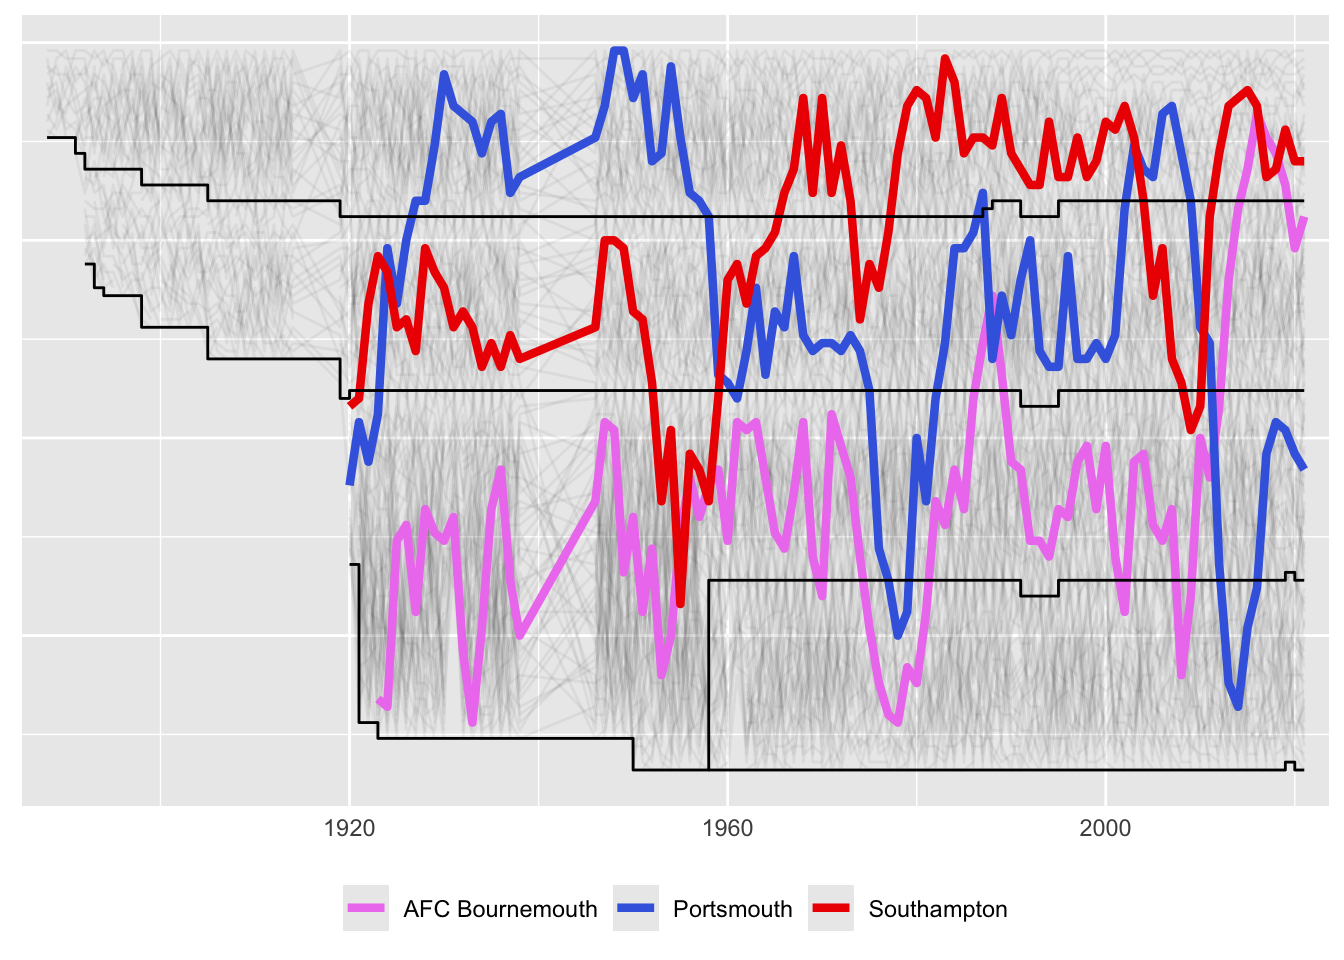
The rankings of all teams are plotted in light grey in the background and the selected teams are plotted in colour in the foreground, ghostplotting. (Specifying colours to match team colours and keep the teams distinct is easier for some groups of teams than for others.) The lowest level of each tier is marked with a black line.

Figure 16.6: Comparing the three South Coast teams: Bournemouth, Portsmouth, and Southampton
Of the three South Coast teams, Portsmouth was the most successful for a long time (including two league titles). Southampton was mostly best from the 1960s on. They briefly dropped to the third tier in 2009 from which they bounced straight back, just as Portsmouth were going up and down in the opposite direction. Bournemouth have pretty well always been below the other two until the last few years.
There is an unusual pattern in the line dividing the top and second tiers around 1990, shortly before the Premier League, replacing the old First Division, was introduced. The First Division had 22 members in 1986-87, 21 in 1987-88, and 20 in 1988-89, returning to 22 teams in its last season, 1991-92. The Premier League began in season 1992-93 with 22 members, but dropped to 20 members after four seasons. These changes were doubtless part of the ongoing negotiations at the time about the distribution of television money to the clubs. The minor bump in the lines dividing the bottom two divisions in 2019 is because Bury were expelled for insolvency in August 2019 before they had played any games.
Plots of historical trajectories of team performance can be found on various Wikipedia sites for individual teams.
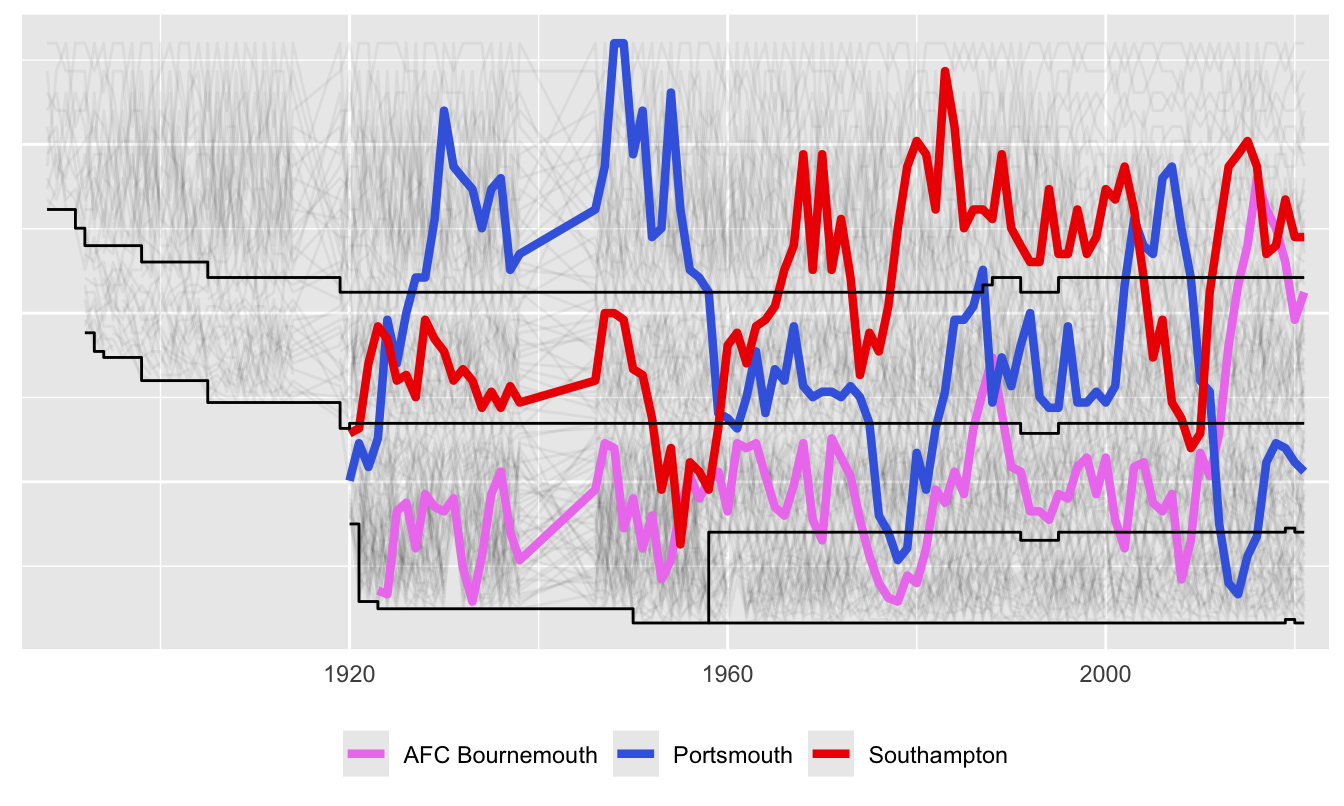
Linear ranks mean that the difference between first and second at the top gets the same weight as any difference between consecutive rankings. To emphasise differences at the top more, the scale can be stretched using a square root function as in Figure 16.7. It is now clearer that Southampton did not ever win the league (they finished second in 1983).

Figure 16.7: Comparing Bournemouth, Portsmouth, and Southampton on a square root scale