21.3 How long do runners take to finish?
The race was limited to 12 hours in the first few years until 1927. From 1928 to 2002 the limit was 11 hours, apart from the 75th race in 2000 when it was extended to 12 hours. Since 2003 the limit has been 12 hours again. In recent years qualifying as a finisher required runners to additionally reach up to six cut-off points along the way within specified times.
Detailed time comparisons across years are difficult because of the different numbers running, the different weather conditions, the different directions of the run (“down” and “up”), and the different distances run. Comrades Marathon Association (2022) gives the distances of the four Comrades Marathons from 2016 to 2019 as 89.2 km, 86.7 km, 90.2 km, and 86.8 km.
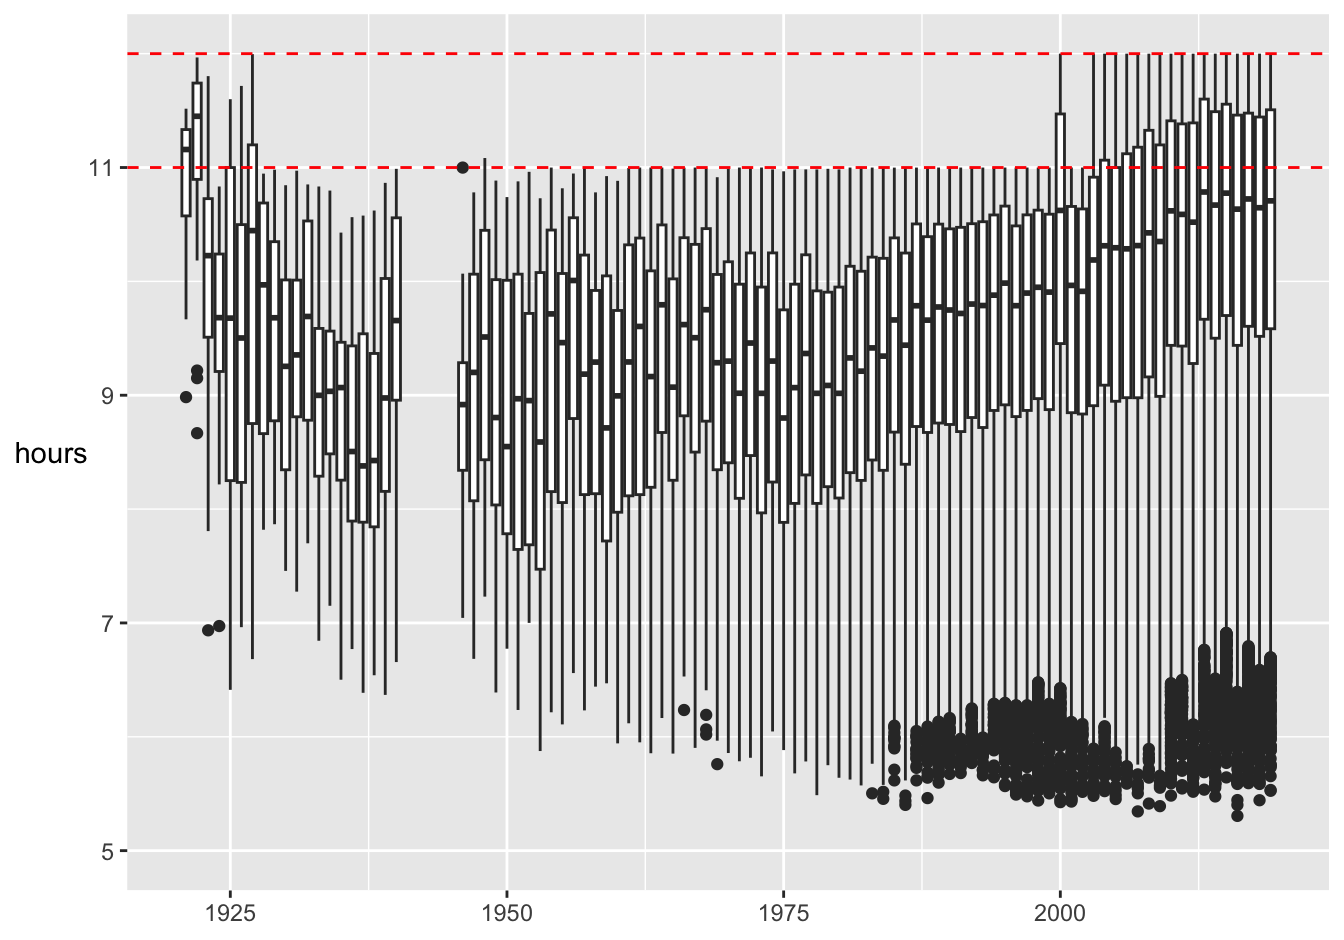
Boxplots of the times in hours for each year are displayed in Figure 21.4. The few times of over 12 hours listed in the dataset have been removed.

Figure 21.4: Distributions of finishing times in hours by year
The wartime gap when no races were run is obvious here as it was in Figure 21.1. The finishing limits of 11 and 12 hours have been marked with red dotted lines. The best times have improved since the early days, but very few runners took part then and support and conditions are undoubtedly far better nowadays. Winning margins were sometimes quite large early on, again because few runners took part. The median finishing time has increased since 1975 as more runners participated. The increased number of participants has also led to more runners being declared ‘fast’ outliers as the boxplot rule for defining outliers has become less stringent.
The distribution of finishing times in 2000 is quite different from the distributions of neighbouring years, having a higher median and higher box. This was due to the extended time limit and the much higher number of participants.
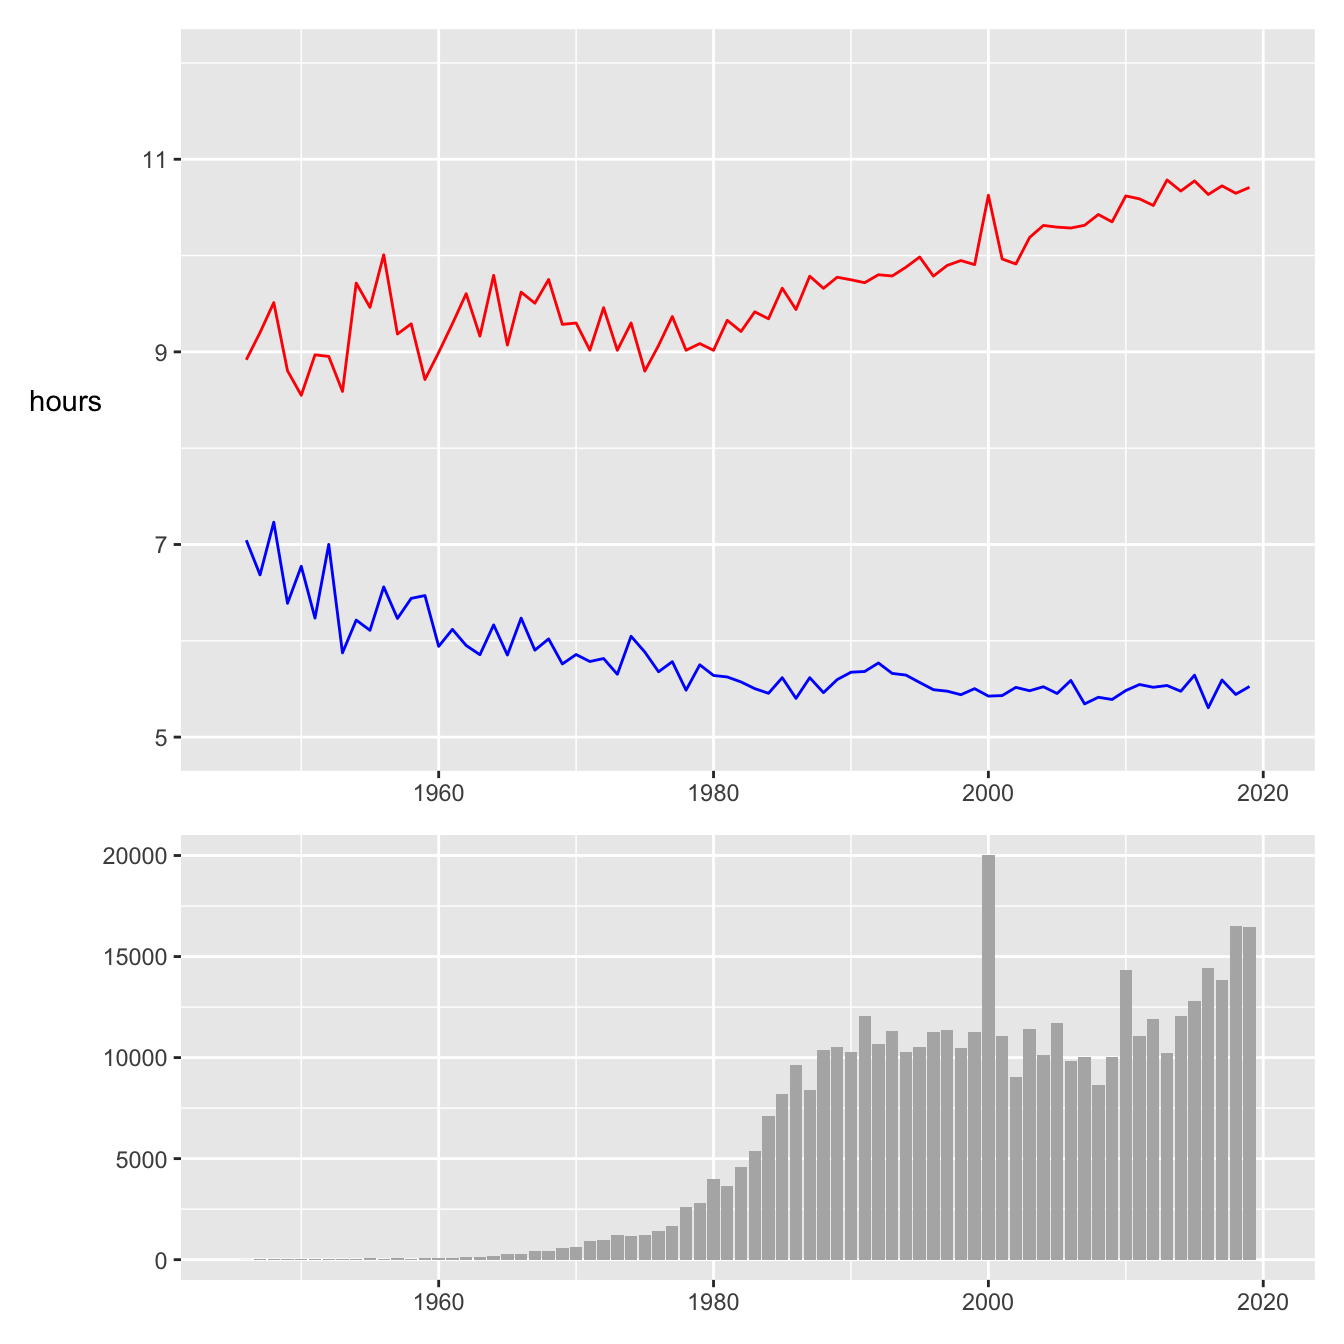
The median and best times in hours are plotted together with the numbers of runners in Figure 21.5.

Figure 21.5: Median times (red), best times (blue) and numbers of finishers (barchart) from 1946 to 2019
This confirms what we know already, but emphasises the huge differences in numbers finishing. The best time has remained relatively constant for a while and the median time has increased.