8.2 Comparing chess players by age and sex
Further information in the dataset includes the sex of the players, their year of birth, and whether they are “active” or not. An inactive player is one who has not played a rated game in the past 12 months (temporarily extended by FIDE to 24 months because of Covid). Gary Kasparov, the former world champion, retired in 2005 and has kept his then rating of 2812. He is recorded as inactive. Comparing the distributions of the active and inactive players gives Figure 8.3. The one-sided peak at 2000 is pretty much all due to the inactive players, as suspected.
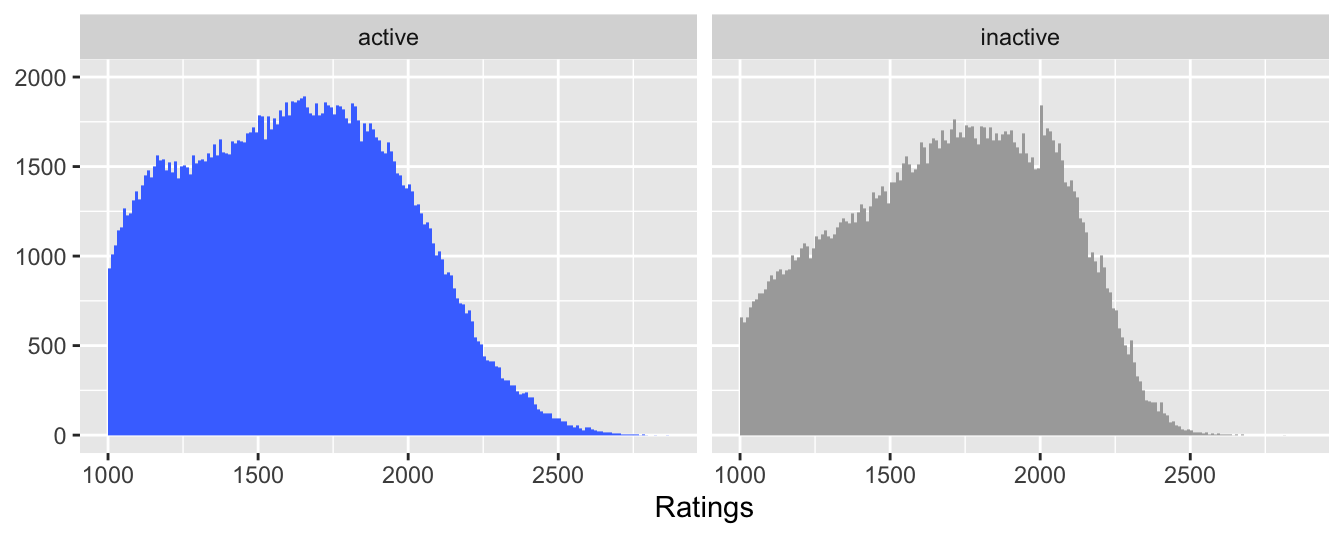
Figure 8.3: Histograms of ratings for active and inactive players
There are relatively fewer inactive players with low ratings. This can be better seen by superposing density estimates for the two groups, as in Figure 8.4.
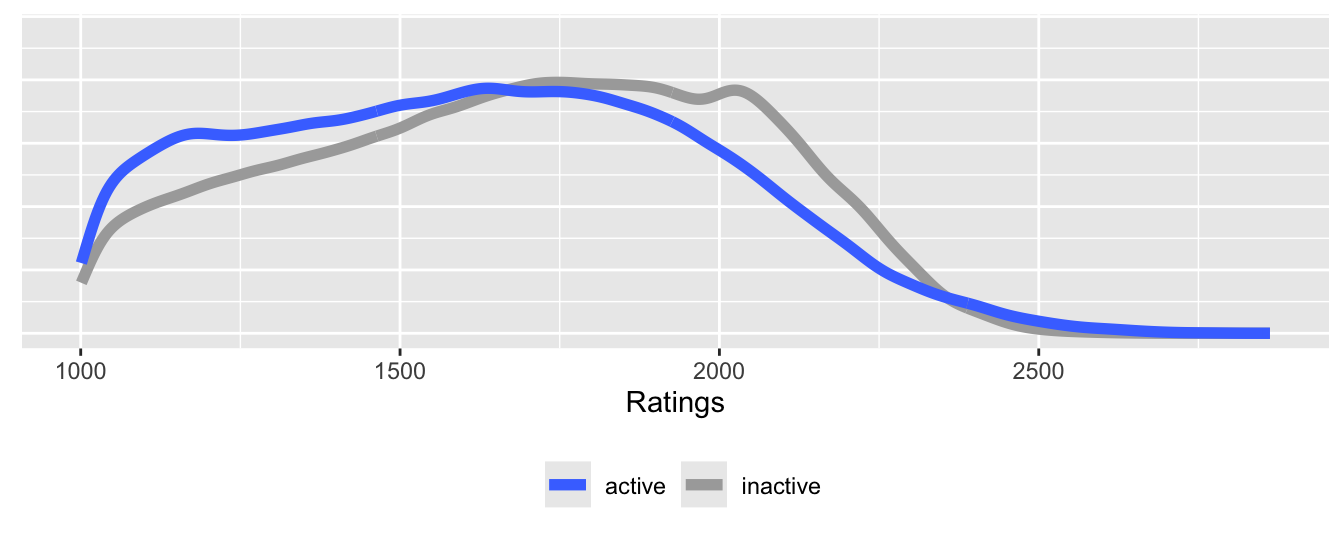
Figure 8.4: Density estimates of distributions of ratings for active and inactive players
Many players take up the game when they are young and do not have high ratings initially. Chess is an extremely strenuous activity at higher levels and there are many reasons why players may stop playing as they get older. The year of birth for a little under 98% of the players is given in the dataset. Plotting density estimates of the distributions of the players’ ages for the inactive and active groups gives Figure 8.5. There is a high proportion of active players who are young, peaking in the early teens.
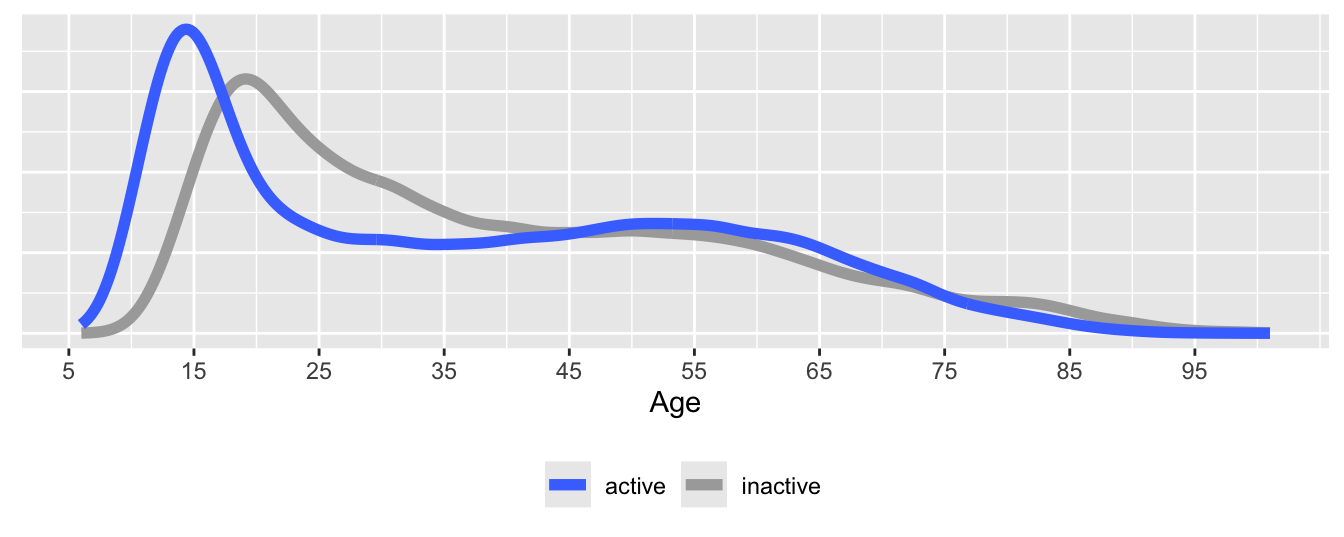
Figure 8.5: Density estimates of age distributions for active and inactive players
Far fewer women play chess than men. In December 2020 women comprised 10.5% of players with a rating. This dropped to 10.1% amongst active players. Figure 8.6 compares the rating distributions for active male and female players.

Figure 8.6: Boxplots of ratings for active players by sex (boxplot widths are proportional to the square roots of the sizes of the groups and outliers are drawn in red)
The female ratings are lower than the male ratings, mainly because far fewer females play. This was analysed in Bilalic et al. (2009) using only German ratings from 2008. The authors concluded that the difference in numbers playing explained about 96% of the rating differences between the sexes for the top 100 players of each sex.
Figure 8.7 shows the data for the December 2020 FIDE ratings for the top 1000 active players of each sex. The male ratings are higher. At the very top the differences are smaller and then they get steadily bigger.
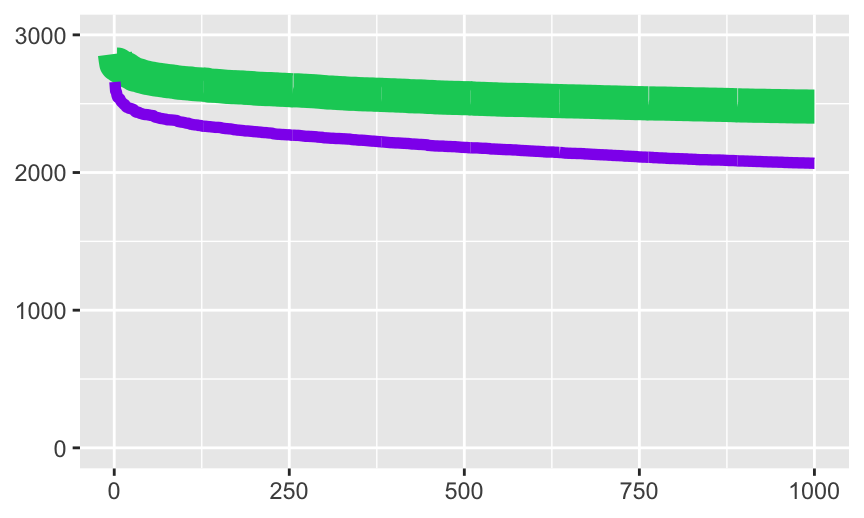
Figure 8.7: Ratings of the top 1000 male and top 1000 female players in December 2020 with line widths proportional to group sizes
The increasing differences can be seen directly in Figure 8.8. This agrees with what Bilalic et al. (2009) found with their data and also with the theoretical expected values they calculated assuming underlying normal distributions of ratings. The FIDE ratings are not normally distributed, but the increasing differences between male and female ratings at these top levels is likely to be true in general for order statistics for groups of such different sizes.
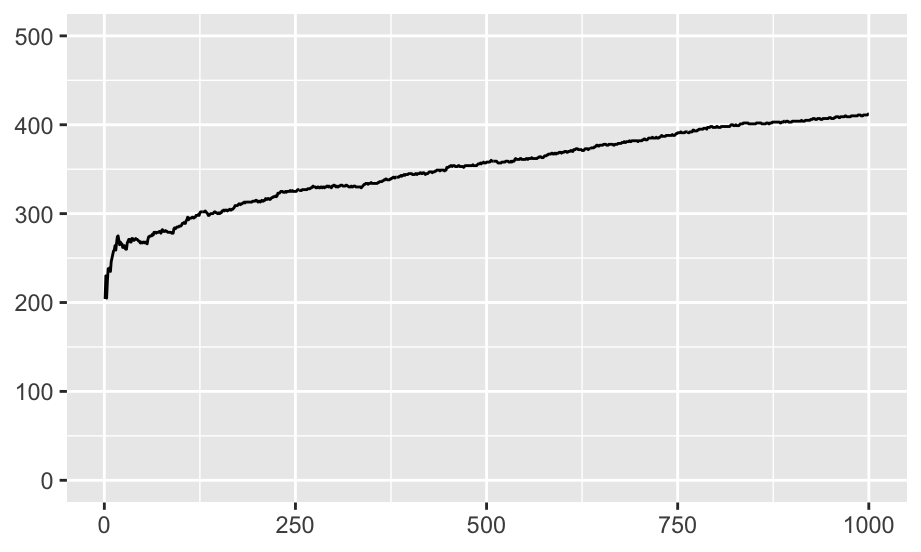
Figure 8.8: Differences between the ratings of the top 1000 male and top 1000 female players in December 2020
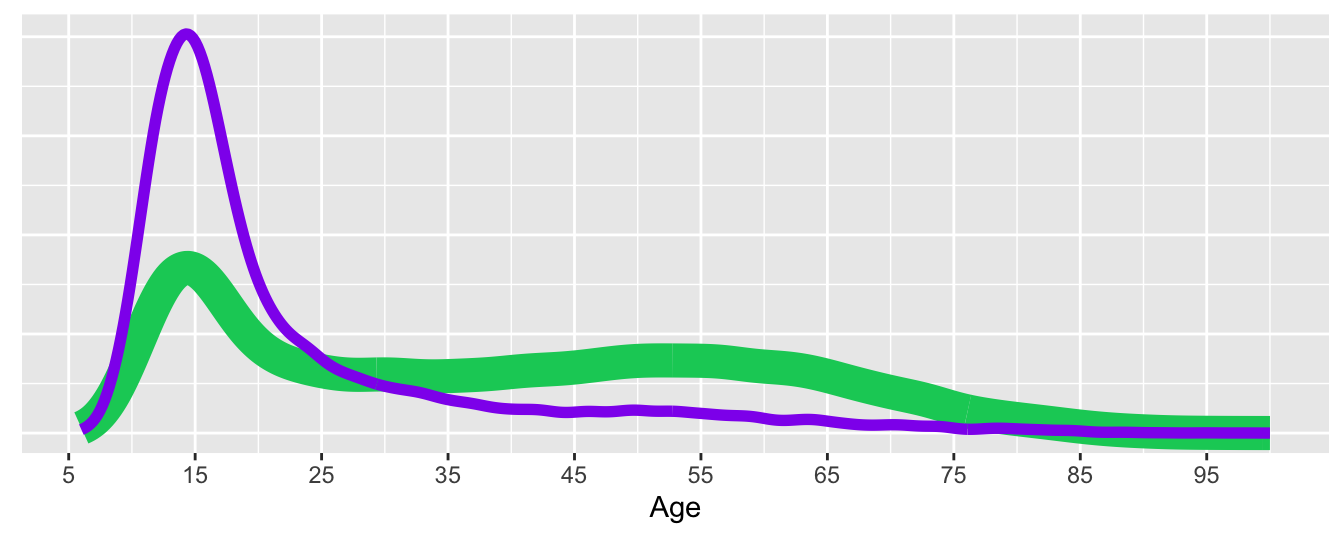
Figure 8.9: Density estimates of age distributions of active players (females in purple, line widths proportional to group sizes)
Age also has an effect as Figure 8.9 suggests. Many teenagers of both sexes play, but the proportion of the young amongst female chess players is much higher than the proportion of the young amongst male chess players. Many young players will give up the game before reaching their full potential. Overall there are about nine times as many male players as female players. Looking at the data in another way, Figure 8.10 shows the absolute numbers of active players by age and sex in December 2020.
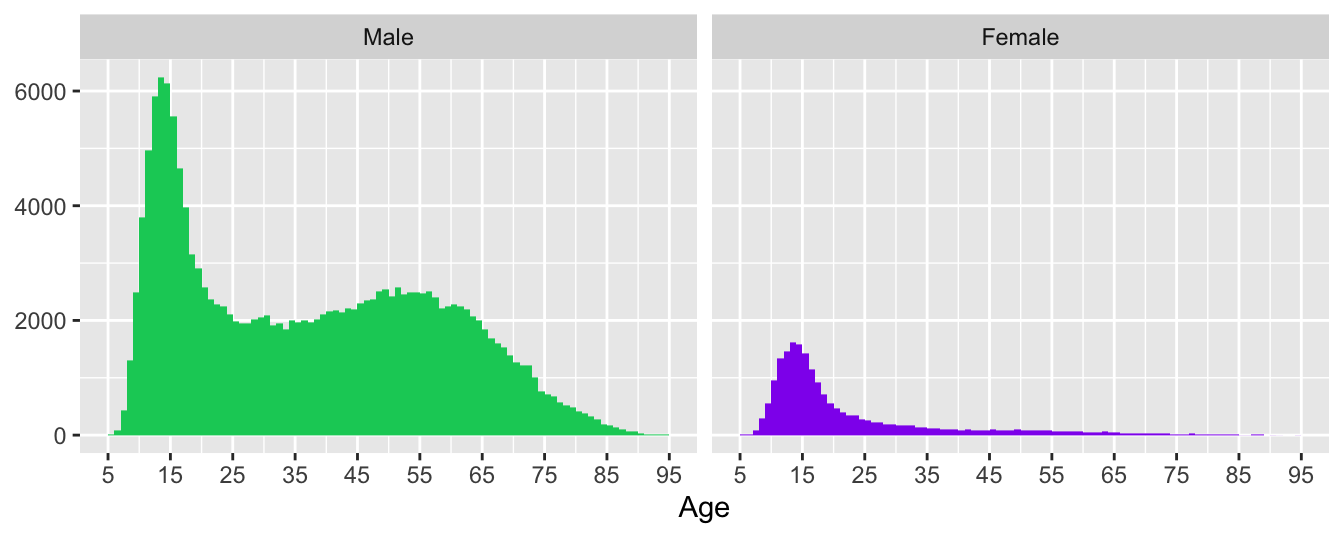
Figure 8.10: Age distributions of active players (females in purple)
The much higher number of male players is obvious, as is the sharp decline in participation by both sexes. What is also clear is that far more older men are still playing. What is not clear is whether the distributional shape is due to there being many more young female players now than there were in the past.