5.1 Michelson, the Master of Light, and his data
Stigler (1977) used Michelson’s 1879 data in a study of robust estimators. For reasons of convenience he split the data into five sets of \(20\) measurements each. Several researchers have since assumed that that was how the experiments were carried out, but Michelson’s report makes clear it was not. Researchers have displayed the data as time series, using the order of the experiments as an equally spaced time index. Again, the original paper provides dates and there were some days with no observations and four which had as many as \(10\). Michelson’s detailed description includes a number of factors which varied between his experiments. To treat all the experiments as independent and identically distributed is a useful first approximation, but not an accurate reflection of what took place. MacKay & Oldford (2000) uses the dataset as a central example for their article on scientific and statistical method. They do respect the order and timing of the data and provide a complete copy of Michelson’s table of experimental results.
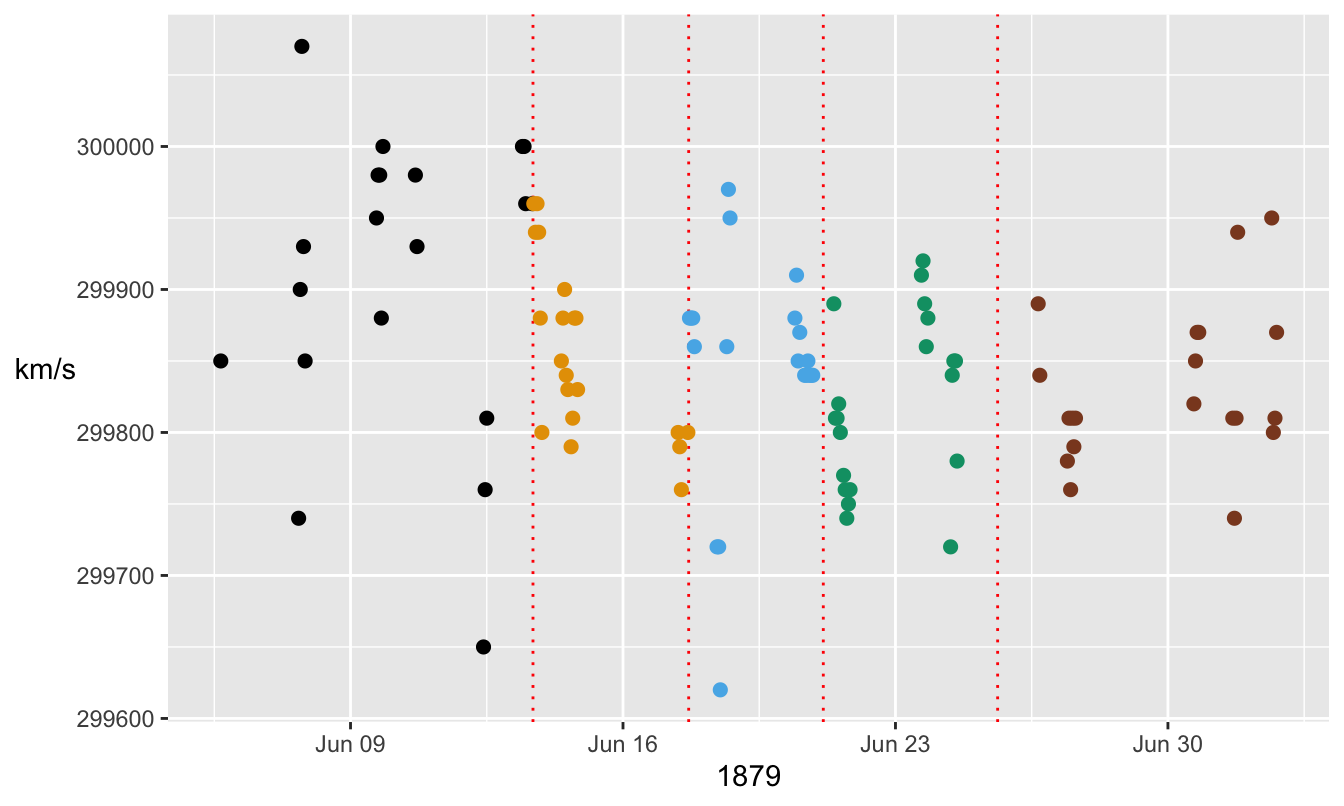
Figure 5.1 shows Michelson’s estimates of the speed of light in air by date and time. Measurements were made on 18 separate days starting on 5 June 1879 and ending on 2 July 1879. Experiments on the same day have been assumed to start at 9 in the morning with one hour gaps in between if recorded as A.M., and at 3 in the afternoon with one hour gaps in between if recorded as P.M. This was done to separate them. The five artificial groupings introduced by Stigler have been coloured, and red dotted lines drawn as boundaries between them.

Figure 5.1: Measurements of the speed of light in air by Michelson by date and time with dotted lines drawn to separate Stigler’s artificial groupings. There is a limited amount of overplotting due to exact equality of measurements close together in time.
Michelson adjusted for temperature and refraction to convert his average estimate of the speed of light in air to the speed of light in a vacuum. Today the speed of light in a vacuum is given as 299792.5 km/s. Converting this to a speed in air using the inverse of Michelson’s conversion gives a value close to 299700 km/s. All but 2 of Michelson’s 100 results are higher than this.
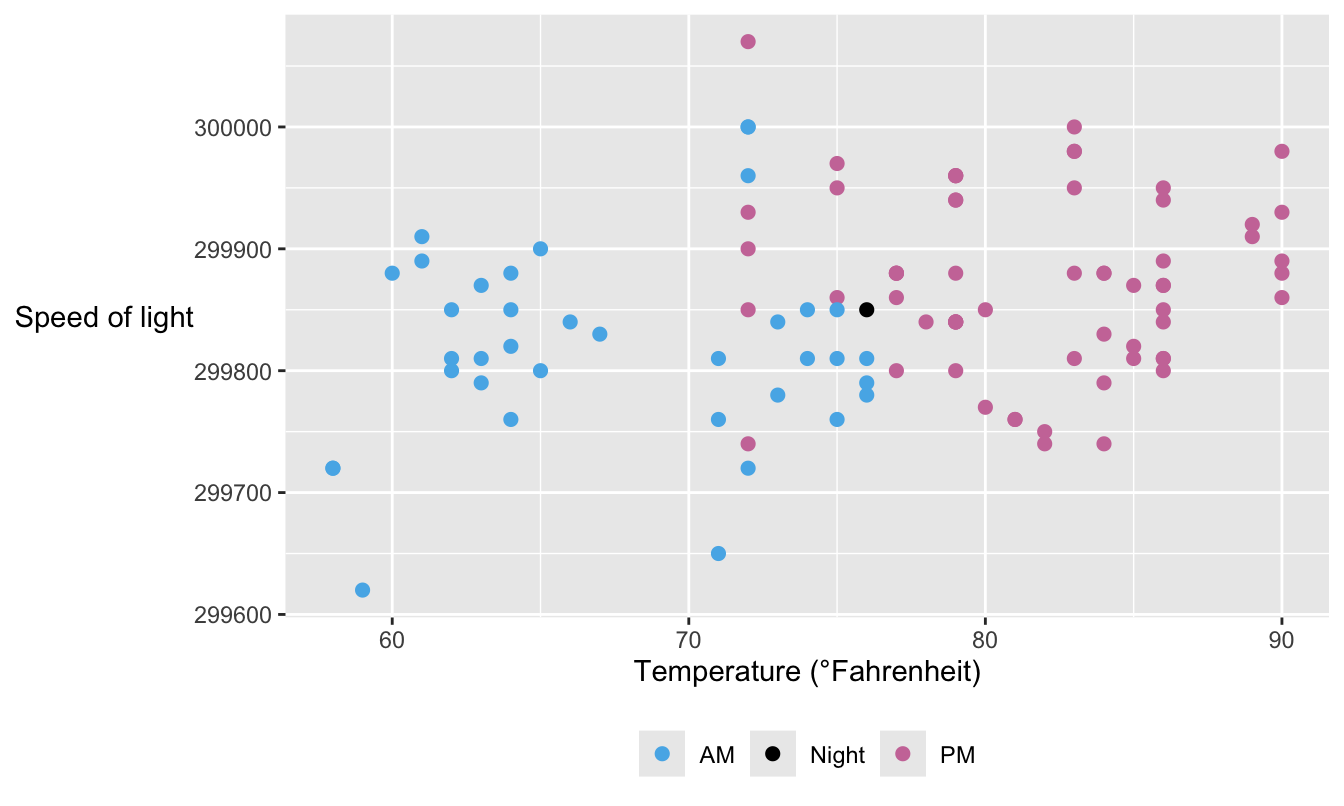
The temperature for each experiment varied from just under 60° Fahrenheit, around 14.5° Celsius, in the morning to as high as 90° Fahrenheit or 32.2° Celsius in the afternoon. Figure 5.2 shows the estimates of speed of light in air vs. temperature. The very first reading was taken at night under electric light, marked black in the figure, but it was regarded by Michelson as unsatisfactory. There is little sign of any effect and this matches the magnitude of Michelson’s correction for temperature that amounted to just over 1 km/s for each additional degree Fahrenheit.

Figure 5.2: Michelson’s estimates of the speed of light in air by temperature, coloured by time of day