4.3 How the nomination contest unfolded
In 1912 the Republicans held their convention first and the party was torn apart by the dispute between the supporters of a previous President, Theodore Roosevelt, and the then President, William Howard Taft. Roosevelt started a new party after the convention and it was expected that splitting the Republican vote would lead to the Democrats’ winning the election. The Republicans and former Republicans together got 7.6 million votes in the election, while the Democrats won only 6.3 million votes, but they won 40 of the 48 states and swept the Electoral College.
There is a good chapter on the 1912 Democratic convention in the first volume of Link’s biography of Woodrow Wilson (Link (1947)). The main source for the analysis here is the official report on the convention (Woodson (1912)) that includes all the counts in detail.
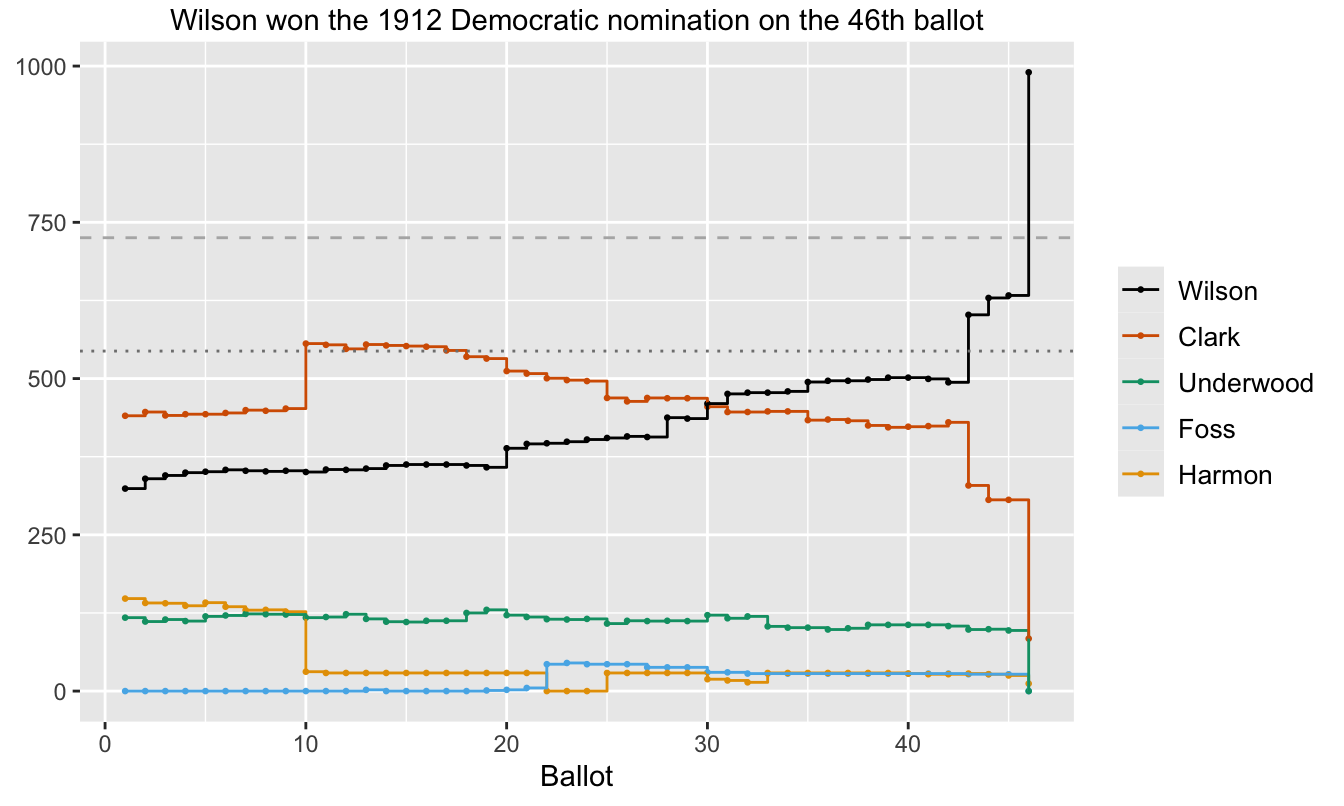
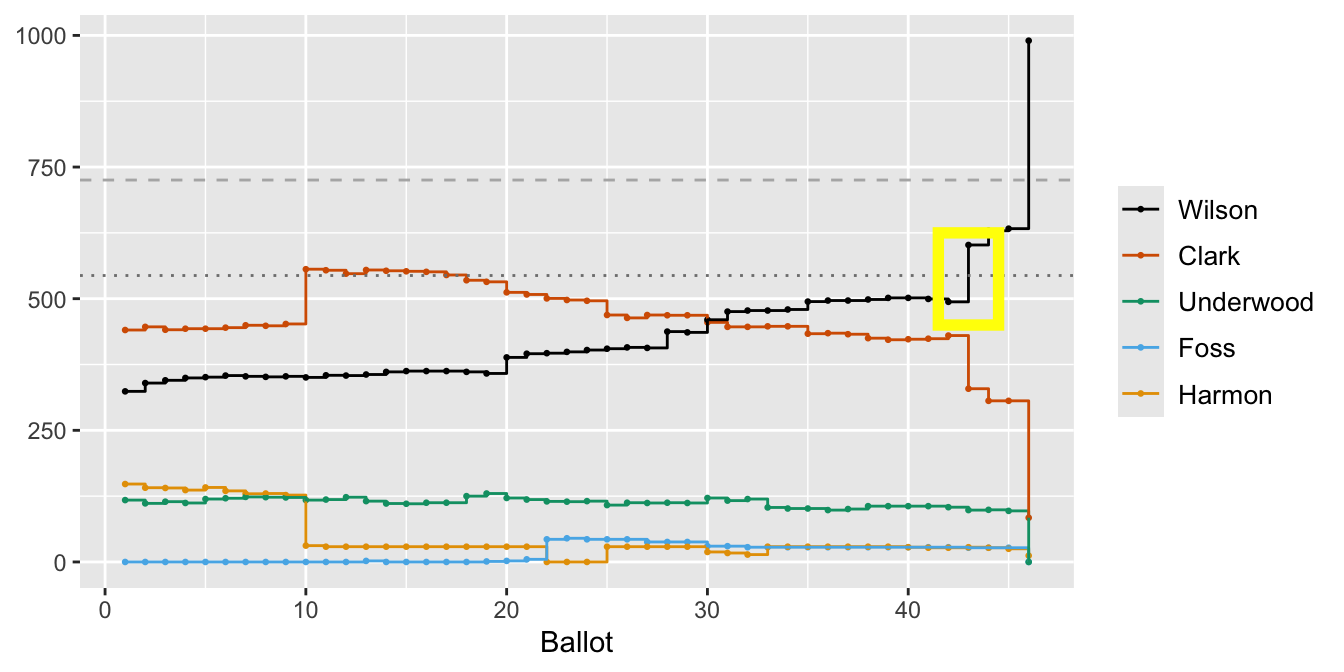
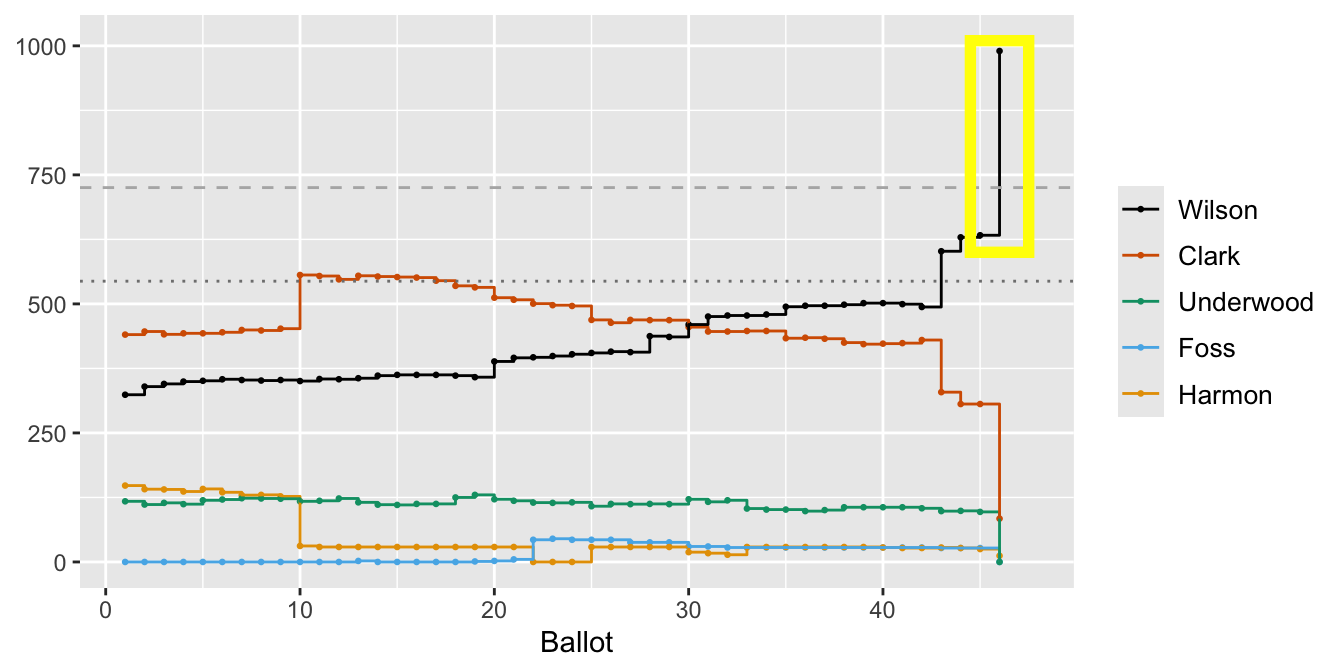
Figure 4.6: Votes for the main candidates over the 46 ballots
Figure 4.6 is a revised version of Figure 4.1 restricted to the more important candidates. A horizontal dashed line marking the level of two-thirds support that was needed to win the nomination has been added, as has a horizontal dotted line marking 50% support. Here are the key developments.
4.3.1 Developments
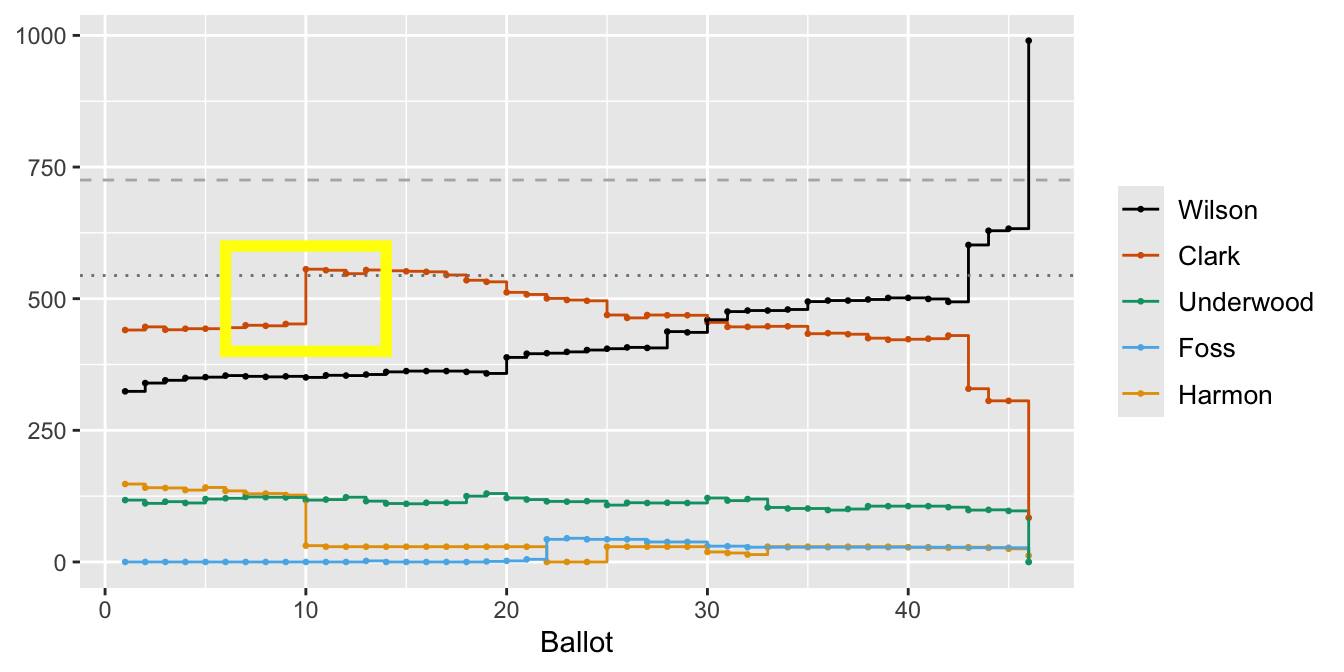
- On the 10th ballot, New York, with 90 delegates, the largest number of any state, switched allegiance from Harmon to Clark, the front runner. This gave Clark an overall majority and it might have been expected that other states would follow. The supporters of Wilson and Underwood—a third candidate with hopes of being selected if Clark and Wilson deadlocked—held firm. They were strengthened by a speech by the three-time Democratic candidate for the Presidency, William Jennings Bryan, just before the 14th ballot. Bryan criticised Tammany Hall, the corrupt Democratic political machine in New York, and rallied the progressive wing of the party.
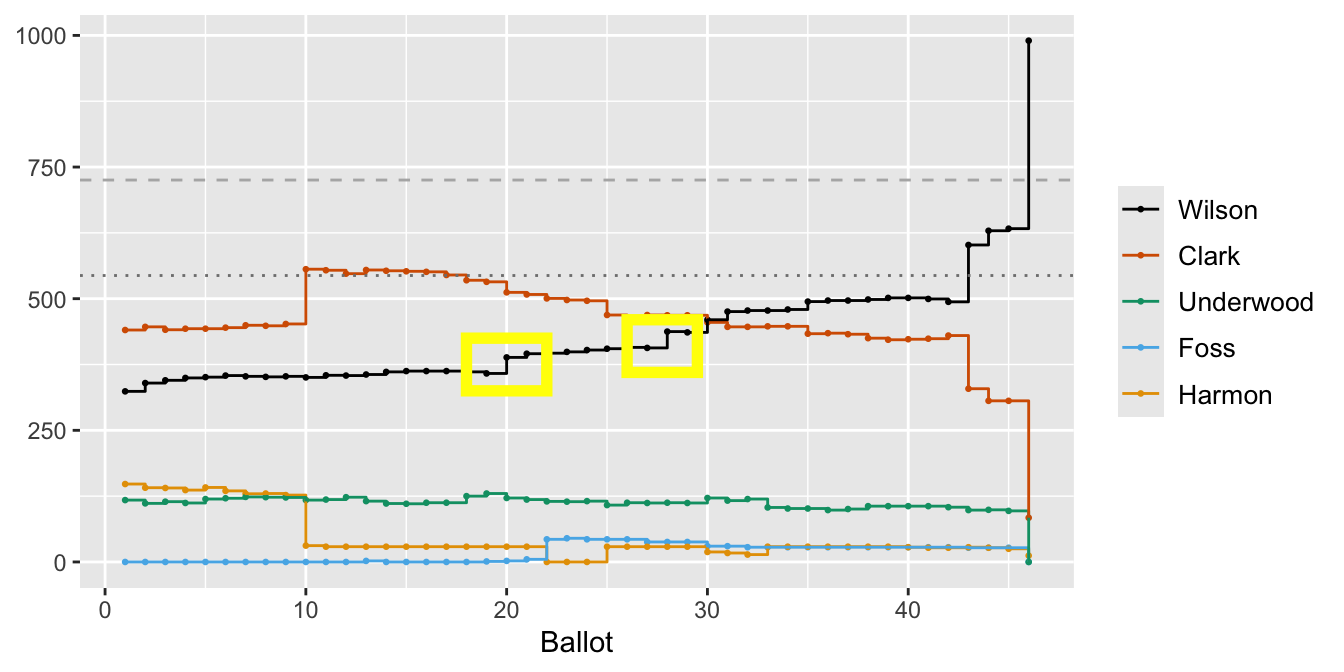
- During the steady decline in Clark’s support there was a gradual increase for Wilson, with minor jumps in support on the 20th ballot (when the 20 delegates of Kansas moved from Clark to Wilson) and on the 28th ballot (when Marshall of Indiana dropped out and 29 of the state’s 30 votes went to Wilson. Marshall went on to be chosen as the party’s Vice-Presidential candidate.)
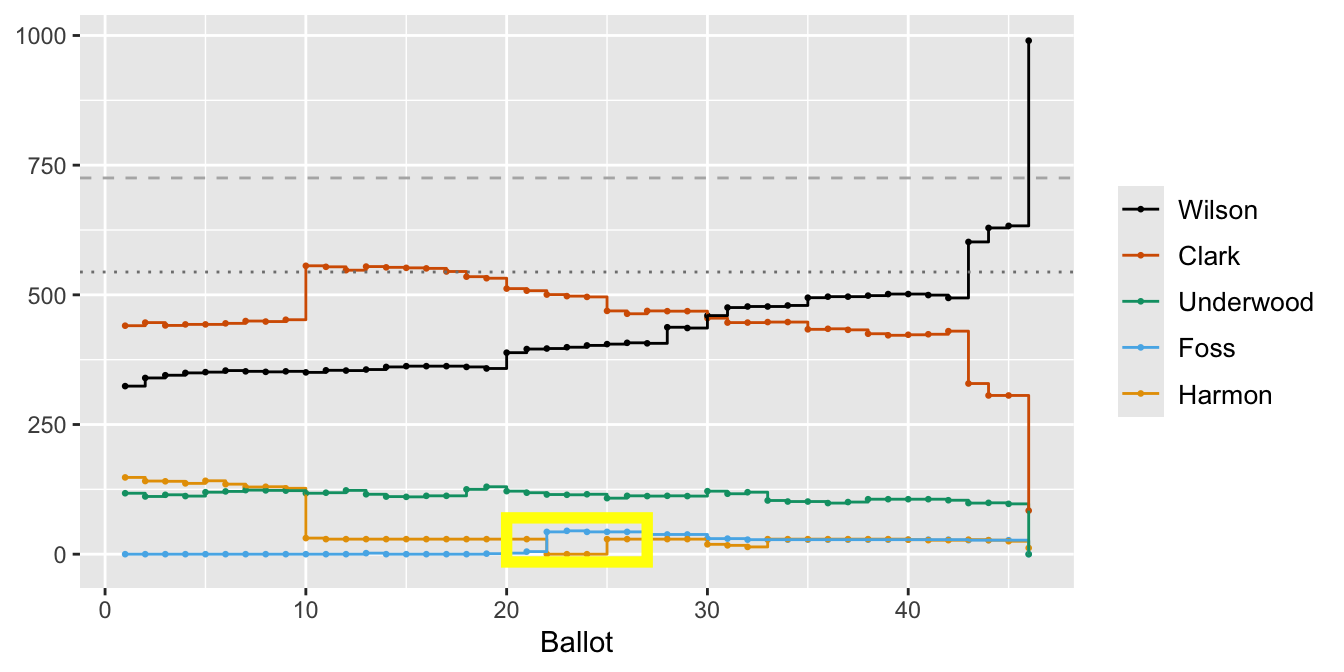
- The introduction of Foss on the 22nd ballot and the reintroduction of Harmon on the 25th ballot were attempts to find a compromise candidate. Neither gained ground.
- Wilson’s breakthrough came on the 43rd ballot, when Illinois with 58 delegates went from Clark to Wilson. This was the first point at which Wilson had the support of more than half of the delegates.
- Before the 46th ballot began, Underwood (with 97 delegates) withdrew without a recommendation to his supporters and it was clear that Wilson would win. Missouri, long-time supporters of Clark, insisted on a final ballot. Their spokesman said: “We are going to cast our vote for Clark on the last ballot. We have got to go back to Missouri.”
Some of these features, possibly the second and definitely the third, would be difficult to identify just from the graphic and without background information. Graphical analysis benefits from an understanding of what is being represented. Dramatic features are easy to spot, but still have to be interpreted. Descriptions of what took place indicate additional places to look in the graphic. Both approaches are valuable and they complement one another. Good graphics can provide summarising overviews, while reports flesh out the details. Neither alone is enough.