31.4 Arranging graphics
Ensembles of graphics are affected by how the individual graphics are arranged, as in Figure 13.1 and Figure 12.1. Other arrangements might not have fitted together as well or given a different impression. It is worth trying more than one, however informative a first arrangement appears.
Small multiples, named and popularised in Tufte (1983), are displays of many graphics of the same type and may have a natural order. The boxplots of chess rankings by age in Figure 8.19 are one example. Often there will be no such natural order, for instance in ordering variables in a scatterplot matrix. Grouping variables by type may be effective, as in §11.2, where two scatterplot matrices are drawn. The first one is for the three dimensions and carat and the second for carat and the remaining three continuous variables. Ordering by statistics of various kinds can be informative, the best strategy is to consider more than one ordering.
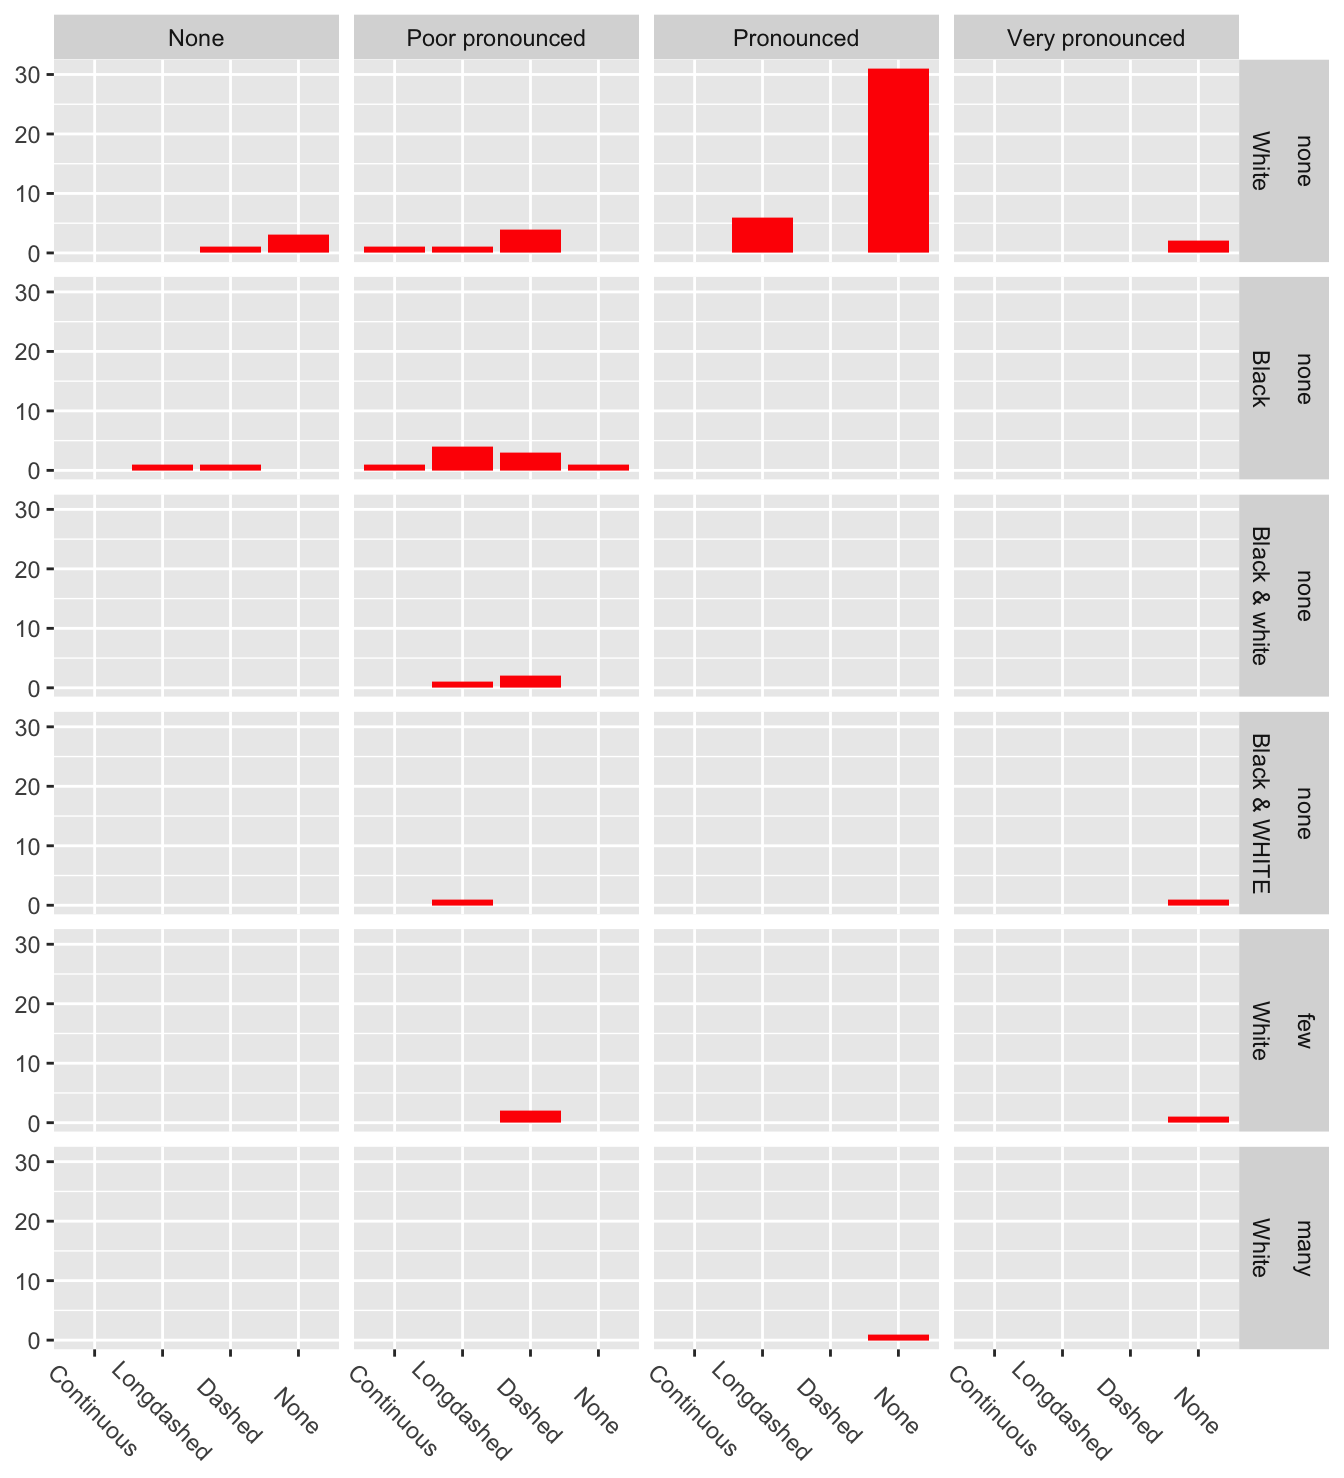
The arrangement of graphics in a faceted display is determined by the faceting variables chosen for the rows and columns, their ordering within rows and within columns, and the ordering of their category levels. This is apparent in Figure 23.4, drawn here as Figure 31.11, showing groups across four shearwater measurements. The rows are arranged first by border and then by undertail, the columns are ordered by eyebrows, and the order of each of those three variables has been specifically chosen. Other orderings would have made it more difficult to interpret the structure.

Figure 31.11: Barcharts of collar faceted by eyebrows, border, and undertail for the Audubon and Galápagos shearwaters
The 22 facets of Figure 3.13, showing numbers of films of different genres over the years, could have been drawn all with the same vertical scale or all with individual vertical scales. It seems more helpful to display them in rows with different vertical scales, but with the same scale across each row.
Main points
- Cases, categorical variable levels, variables can all be sorted and ordered.
- The impact of boxplots, faceted plots, mosaicplots, and parallel coordinate plots is strongly influenced by the orderings within the plots.
- Ordering categories is better than leaving them in a default alphabetic order.
- There are no best sortings and orderings: there are very many of them. Different alternatives may reveal different information.