9.3 Comparing responses to related, but different questions
Another question about same-sex marriage was whether respondents were in favour of or opposed to introducing a Constitutional Amendment making same-sex marriage illegal. All respondents were asked and the support shows a quite different pattern with age to that of Figure 9.1, as can be seen in Figure 9.8.
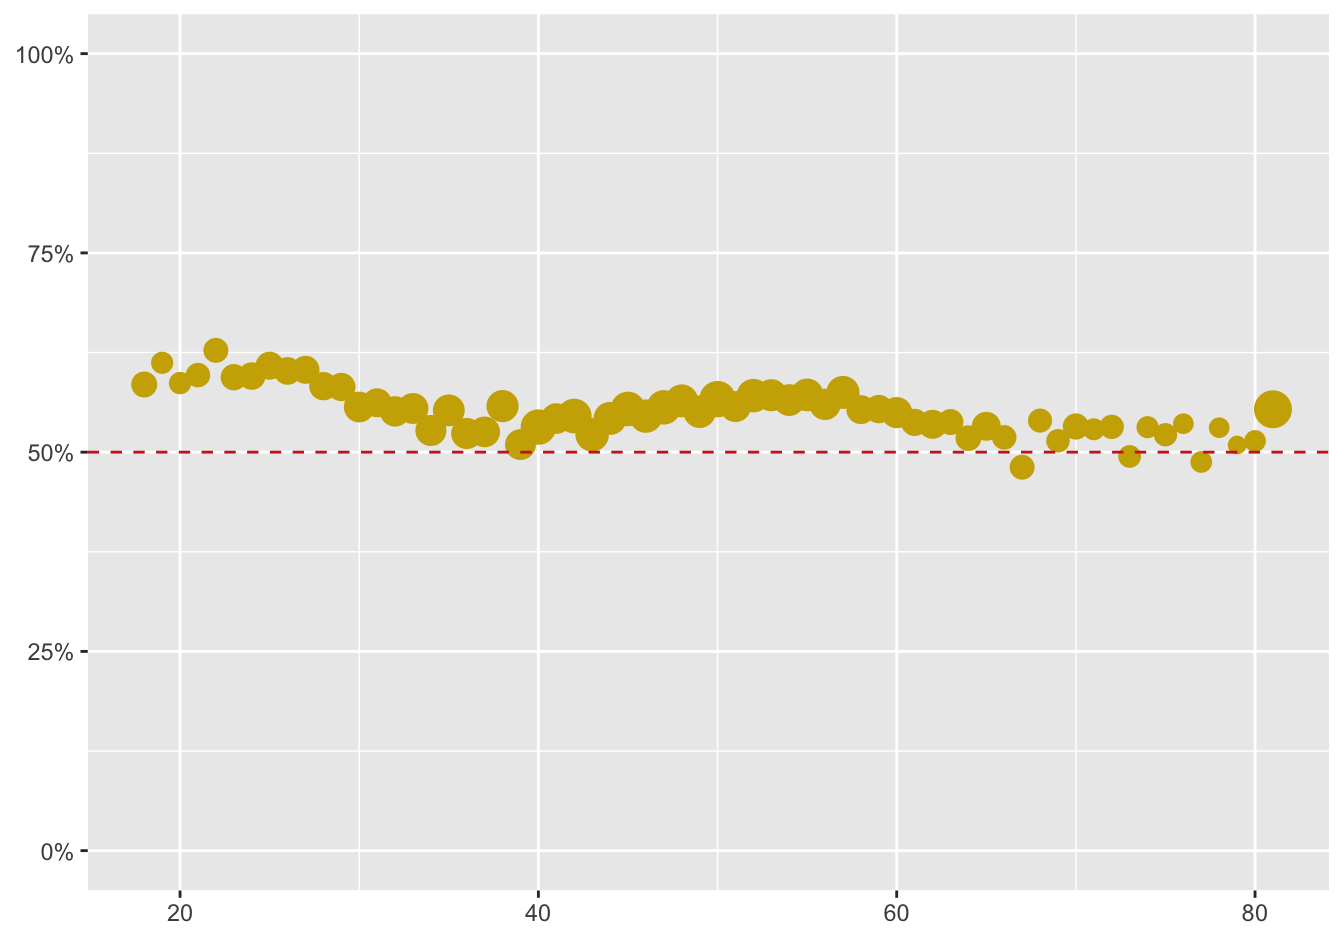
Figure 9.8: Scatterplot of opposition to a Constitutional Amendment making same-sex marriage illegal by age of respondent. Cases with any values missing have been excluded and data for ages above 80 have been combined into one value at 81. Point areas are proportional to the number of respondents of that age.
While there was a majority against same-sex marriage at state level for most ages except the youngest, there is a majority against a Constitutional Amendment at almost every age. There is also little difference in opinion across the ages concerning a Constitutional Amendment.
Including the influence of sex and drawing the graphics for the two questions beside one another helps making comparisons. Opposition to a Constitutional Amendment is higher for females than males at every age. The greater variability in the left graphic on state law is because only a third of the survey population was asked this question.
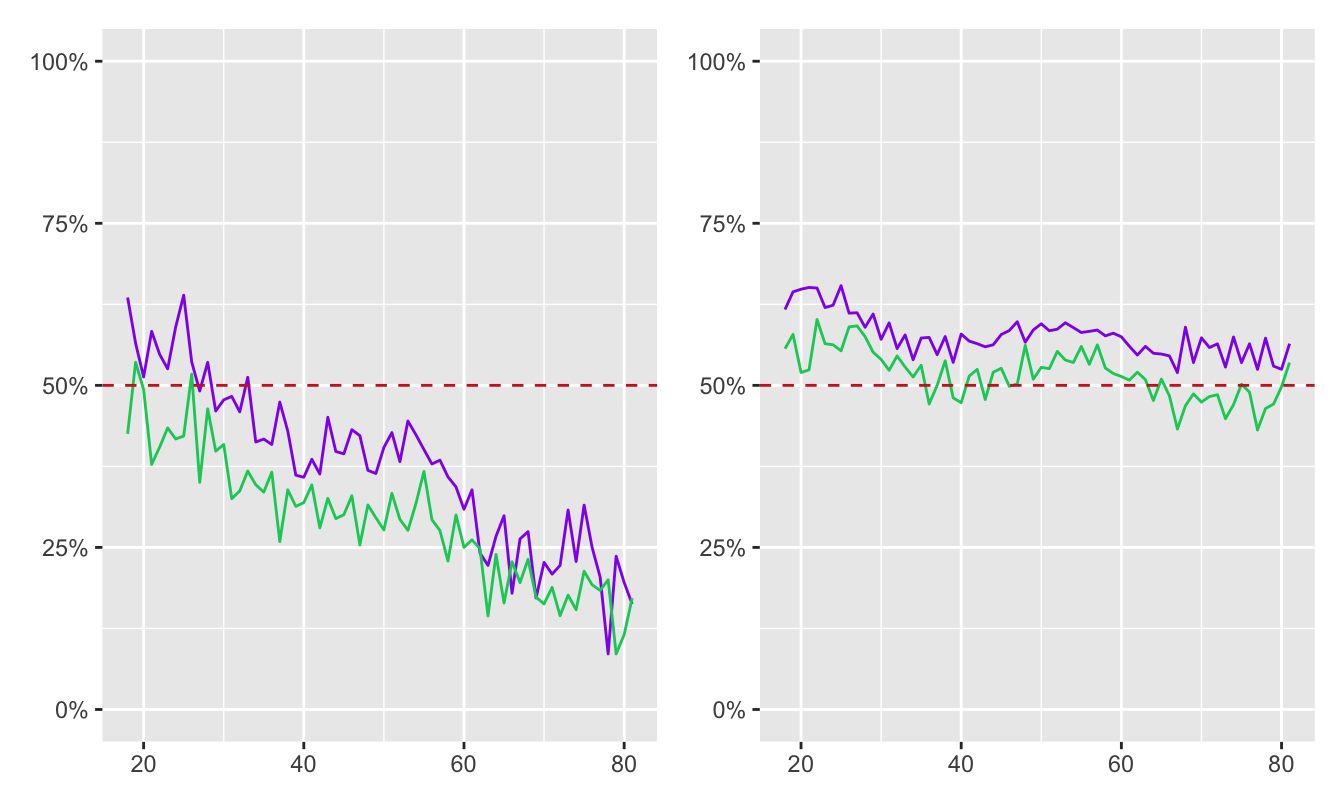
Figure 9.9: Line plots of support for same-sex marriage at federal level (left) and opposition to a Constitutional Amendment (right) by age of respondent by males (green) and females (purple)
The differences between the graphics depend on the exact form of the questions asked. Annenberg provide access to the full survey information on request. There were two versions of the state question asked at different times in the 2004 survey and five versions of the federal question. The differences within each group were slight, but there were major differences between the two groups. For the state question, “in favour” meant in favour of same-sex marriage. For the federal question, “in favour” meant in favour of a Constitutional Amendment banning same-sex marriage. Respondents to this question were offered an additional possible answer of “Neither favor nor oppose”.
Figure 9.10 shows barcharts for the full sets of responses on both questions, excluding respondents who were not asked. Most people with opinions on the issues have strong opinions. The different framings of the two questions were important.
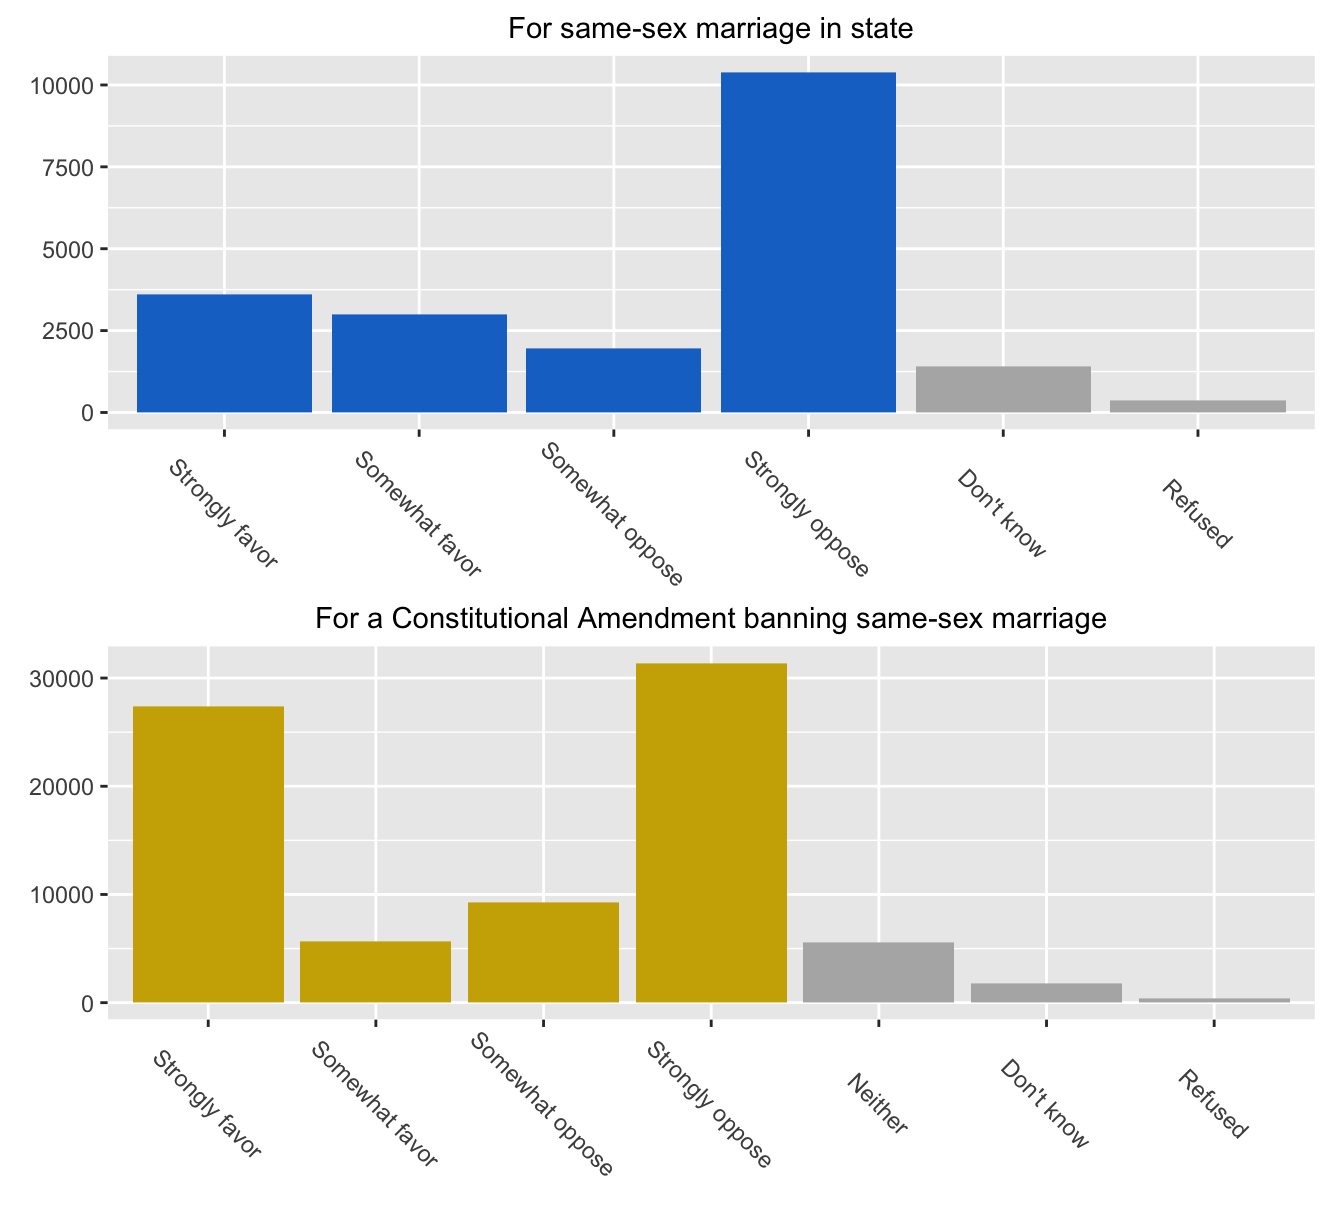
Figure 9.10: Barcharts of the full responses to the two questions
There were small numbers of “Don’t know” and “Refused”, as well as some who were neither for nor against the Constitutional Amendment question. Those who did not express opinions one way or the other have been coloured grey. The vertical scales are quite different, as only one third were asked the state question.
Figure 9.11 studies how those responded who gave their opinions on both questions, either strongly or just somewhat. Comparing answers of individuals is more informative than comparing distributions of aggregated answers.
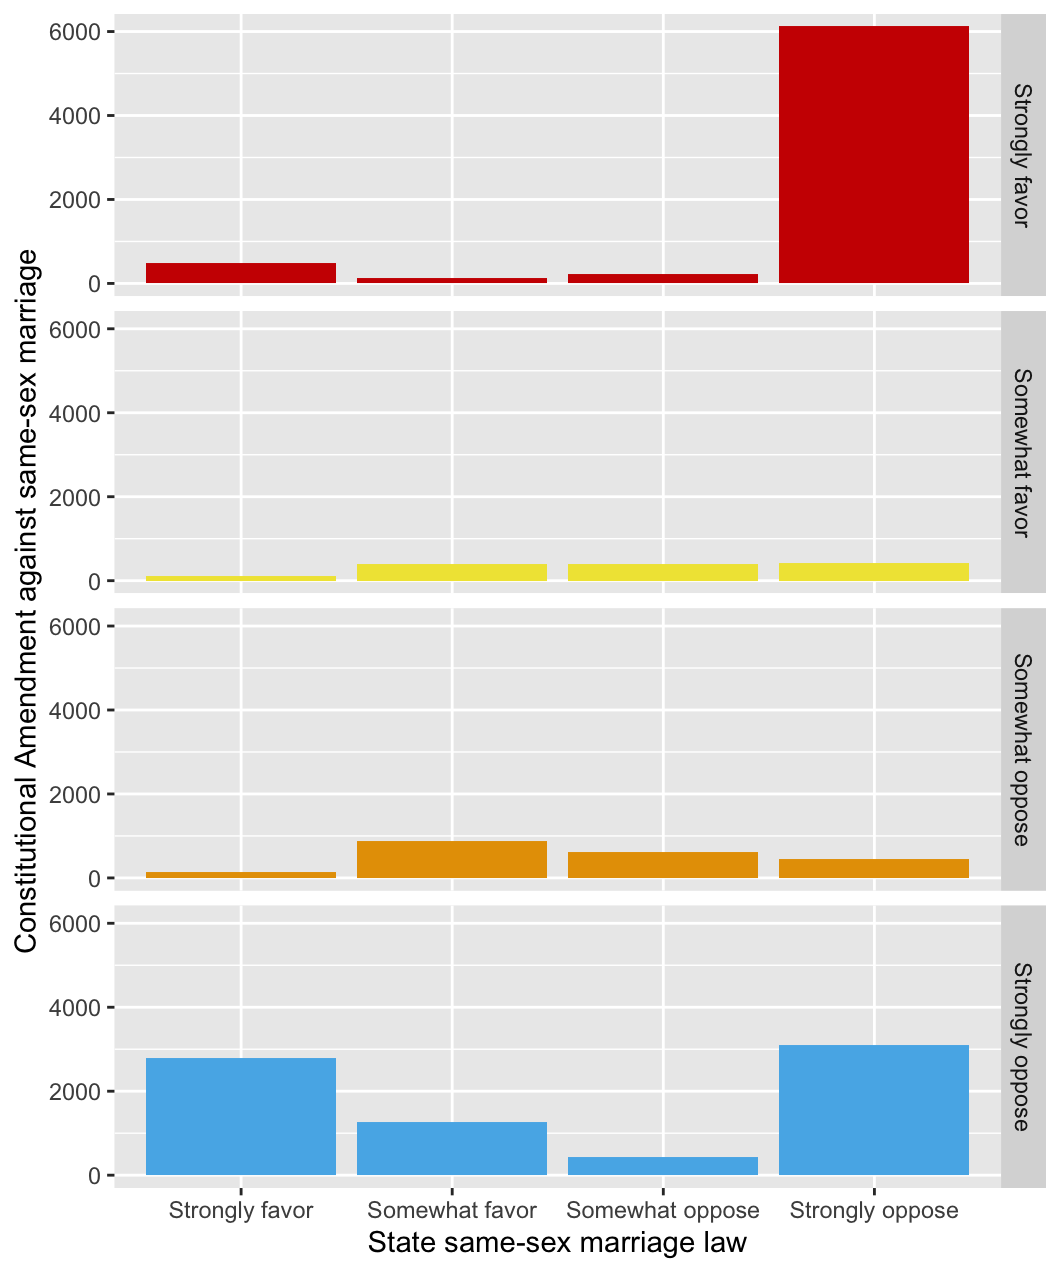
Figure 9.11: Multiple barcharts of the responses to supporting same-sex marriage at state level by the responses to supporting a Constitutional Amendment banning it
The most interesting feature is the combination of strongly opposing a same-sex marriage law for your own state while also strongly opposing a Constitutional Amendment banning same-sex marriage (bar lower right). This group is the main reason for the difference between the two graphics in Figure 9.9.
Responses to the two questions across the states can be compared by looking at the proportions who responded in favour of a state law for same-sex marriage and those who opposed a Constitutional Amendment making same-sex marriage illegal. Figure 9.12 shows the result, with circle sizes proportional to numbers giving an opinion on the Constitutional Amendment question.
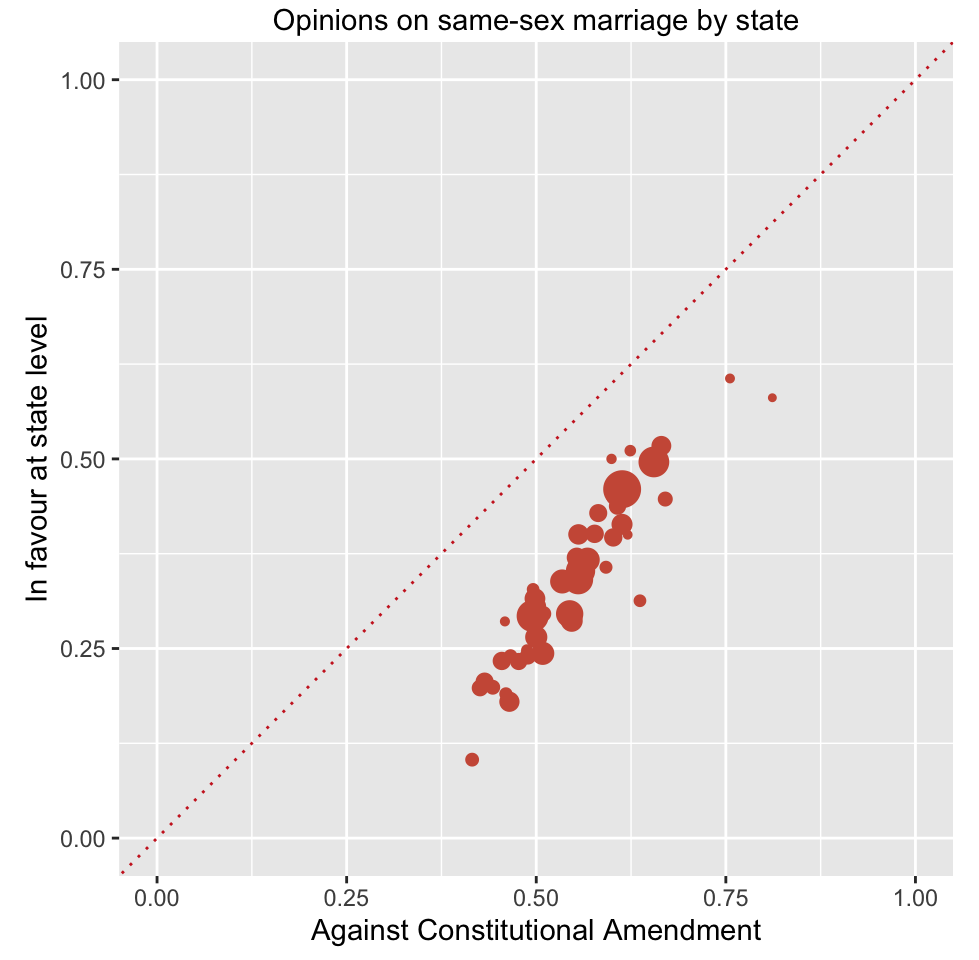
Figure 9.12: Scatterplot of responses to the two same-sex marriage questions by state (point areas are proportional to the number of respondents in that state)
Opposition to the Constitutional Amendment making same-sex marriage illegal was much stronger than support for a state law permitting same-sex marriage in all states. The two responses were highly correlated across the states with a slope greater than one, so as the federal variable rate increased, the state rate increased more. Opinions on gay rights are a complicated matter and there were several other related questions asked in the Annenberg survey. Much more analysis could be done. That survey was carried out almost twenty years ago and more recent surveys suggest that the US population has become more favourably disposed towards same-sex marriage.
Answers Older people were more against a same-sex marriage law in their state. Women were more in favour than men at all ages. There was a majority at all ages against a Constitutional Amendment banning same-sex marriage.
Further questions Respondents were asked additional related questions: How did their responses to those relate to their responses on same-sex marriage? What results do more recent surveys show? How do people’s opinions vary on other contentious issues in the survey?