26.4 How do first-past-the-post and party votes compare?
Comparing the two votes for the six parties who got the most Zweitstimmen means dropping Die Linke and including the FDP.

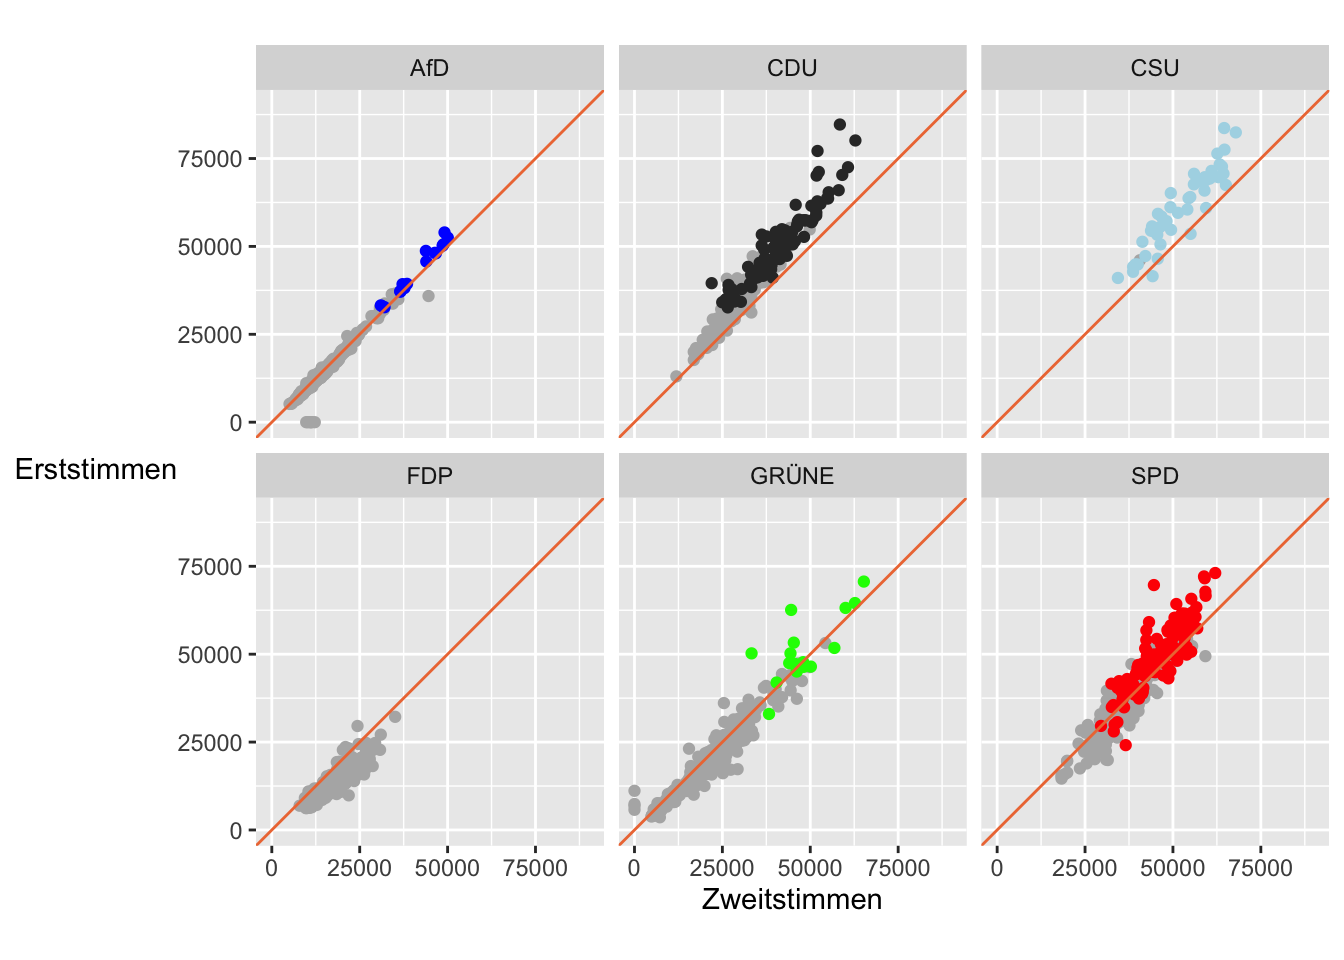
Figure 26.19: Erststimmen and Zweitstimmen by major parties (brown lines mark equality and seats that were won on Erststimmen are coloured by the party’s colour)
There was more agreement than might have been expected. AfD voters stuck closely to their party, with the exception of six seats where they had no individual candidate and one seat in Thüringen, where the CDU ran a well-known right-wing candidate (although the SPD candidate still won). The CDU and CSU candidates generally got more votes than the party, possibly from the FDP and smaller parties who had no chances of winning individual seats. The Greens did not qualify for Zweitstimmen in Saarland, as previously discussed. Otherwise there were some seats where individual candidates did particularly well relative to their party. This happened with SPD and CDU candidates too.
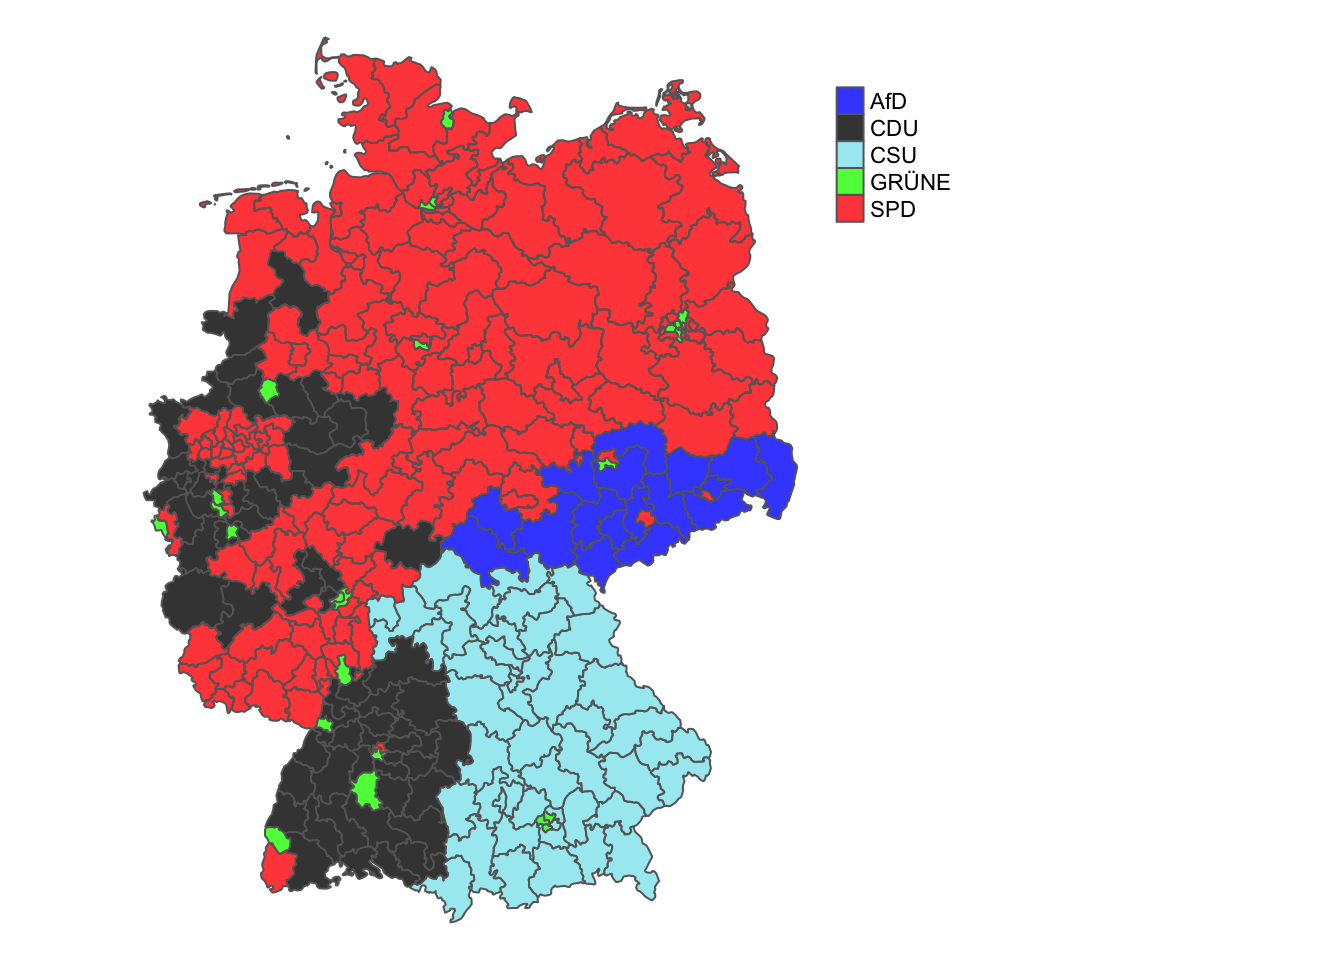
Figure 26.16 was plotted using Erststimmen to show which parties won the individual seats. Replotting with Zweitstimmen and colouring by which party had the most votes in each constituency gives Figure 26.20.

Figure 26.20: Which party got the most Zweitstimmen in each constituency
Figure 26.20 presents a more coherent pattern than Figure 26.16. As has been pointed out on Francois Valentin’s Twitter feed (Valentin (2022)), the map’s form is reminiscent of how voting in Germany looked over a hundred years ago. The SPD won most votes in the area that was Prussia, the AfD won most votes in Saxony, and the CSU most in Bavaria.

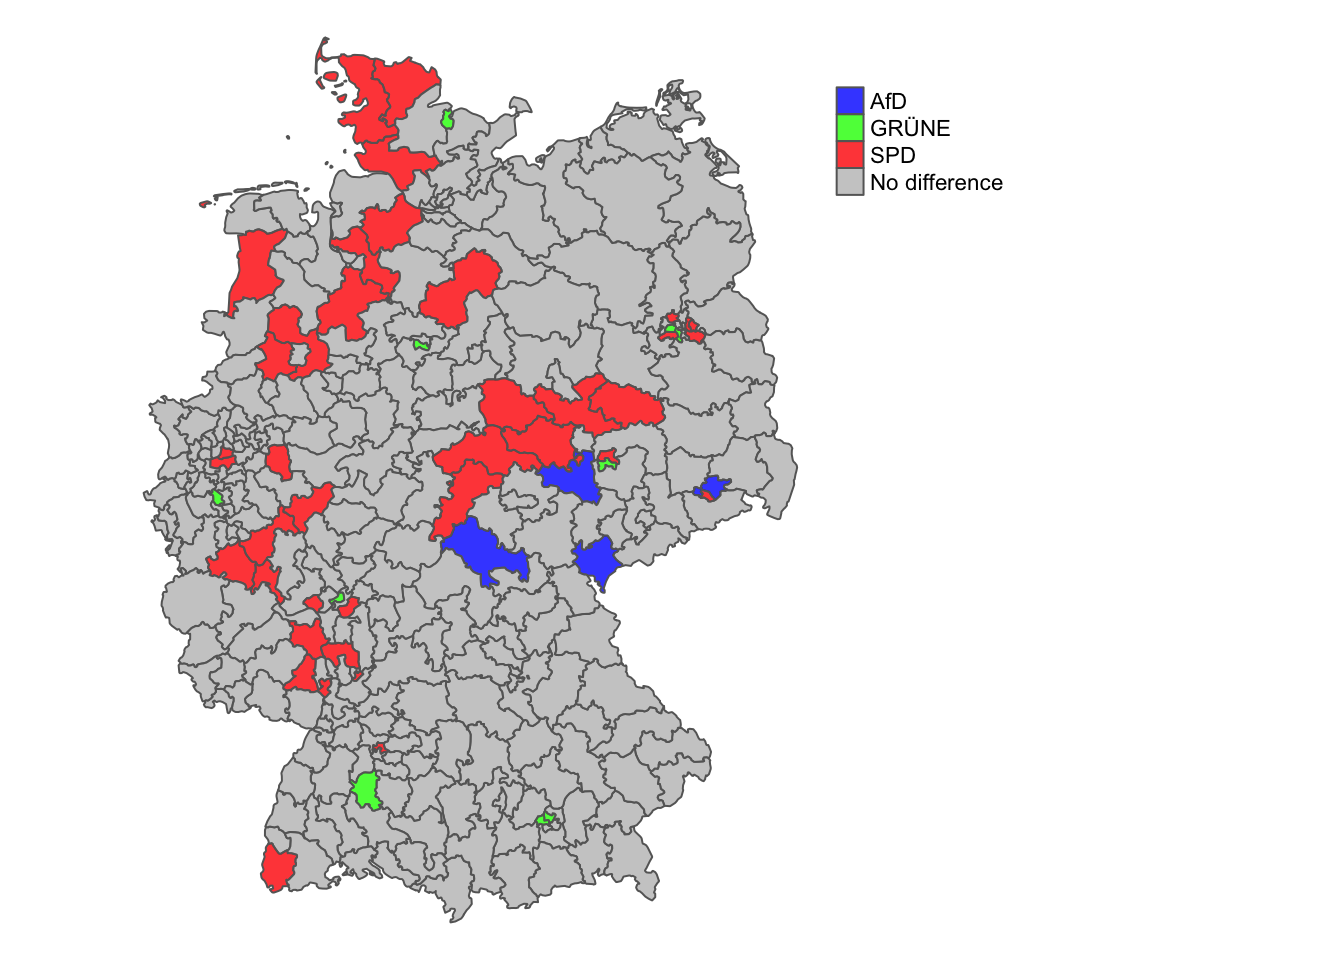
Figure 26.21: Consituencies where the party that got the most Zweitstimmen did not get the most Erststimmen, coloured by the party with the most Zweitstimmen
In many constituencies the party of the candidate that had the most Erststimmen also received the most Zweitstimmen. Restricting the map to the constituencies where one party had the most Erststimmen and another the most Zweitstimmen and colouring by the party with the most Zweitstimmen gives Figure 26.21. SPD candidates failed to win seats on Erststimmen relatively often, while Green and AfD candidates failed occasionally. Neither the CDU nor the CSU ever failed to win on Erststimmen when they won on Zweitstimmen.
Answers The Greens, the SPD, and “Other” parties did well in the 2021 election (compared with the 2017 election). There are strong geographical patterns of party support, for instance for the Greens and the AfD. The Greens did better in urban constituencies than in rural ones. Candidates winning individual seats with Erststimmen almost always won less than 50% of the votes in 2021.
Further questions Which structural factors were most important? Why did parties do much better in certain individual seats than in other similar ones?
Graphical takeaways
- UpAndDown plots show relative and absolute changes in the same plot. (Figure 26.4)
- Draw smaller groups last if colour is used and there is overplotting. (Figures 26.8, 26.11, and 26.14)
- Scatterplots reveal many kinds of information, e.g., points with equal values (Berlin in Figure 26.14), differences between groups (Berlin compared with the rest of the East of Germany in Figure 26.11), unusual cases within highly correlated variables (Figure 26.19).
- Highlighted parallel coordinate plots identify potential explanatory variables. (Figures 26.12, 26.9, and 26.15)