25.2 Which groups had high survival rates?
Investigations of the earlier, less detailed datasets in R showed that survival rates were higher for women than men, that first class passengers had higher survival rates than second class, and that second class rates were higher than third class rates. The survival rate for the crew was almost as high as the rate for third class and this was assumed to be partly because crew members were assigned to man the lifeboats. This can be confirmed by the more detailed information now available. Figure 25.8 is a doubledecker plot of the survival rates for the different groups on board. The width of each bar is proportional to the number in that group.
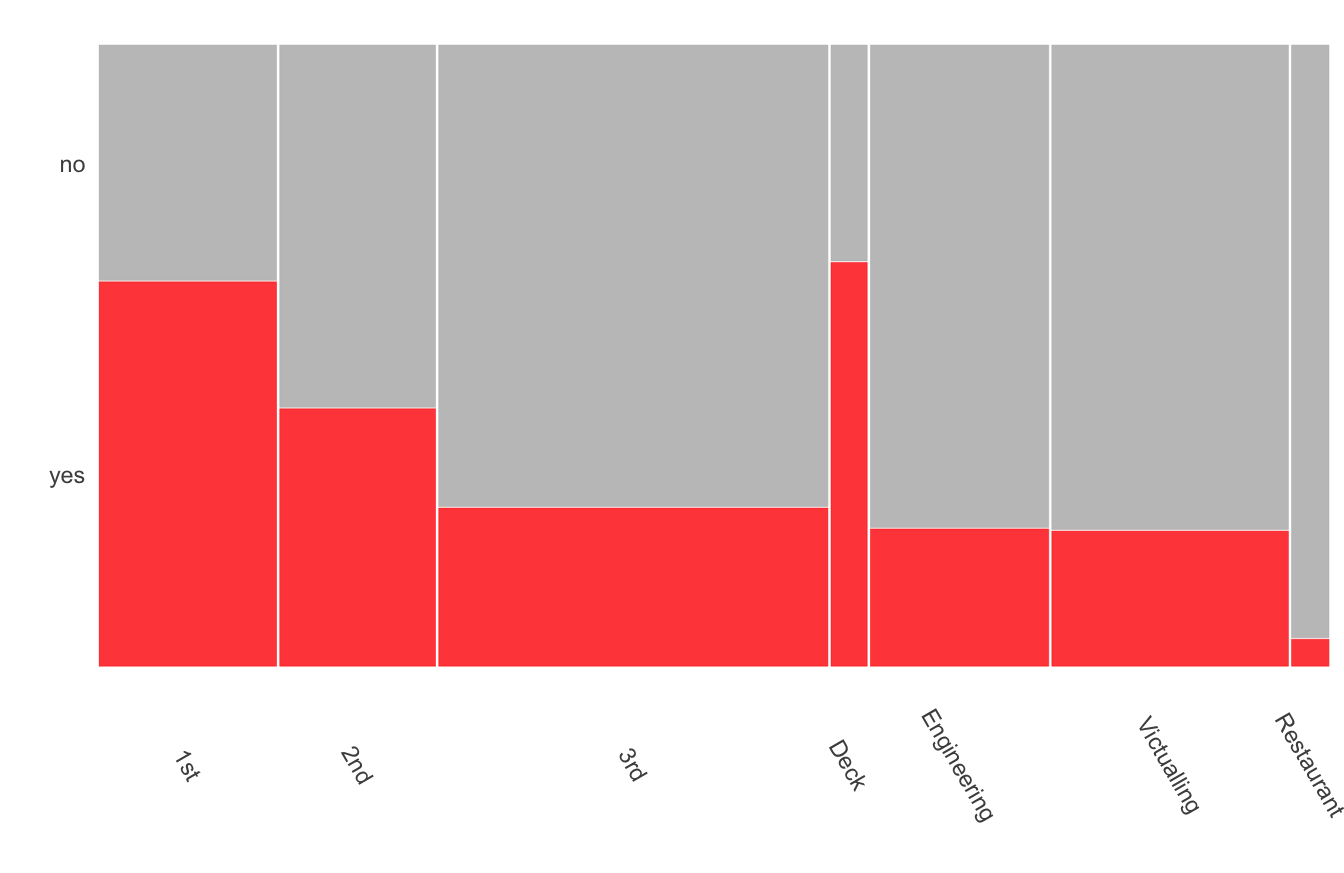
Figure 25.8: Titanic survival rates by passenger class and crew department
Deck crew members had a higher survival rate than even first class passengers. They would have been the crew assigned to the lifeboats. Survival rates for other crew members were lower than for third class passengers and those working in the restaurant had a particularly low rate of survival.
Sex was an important factor as Figure 25.9 shows. All female passenger groups had higher survival rates than all male groups. Second class males had the worst survival rate of all passengers.
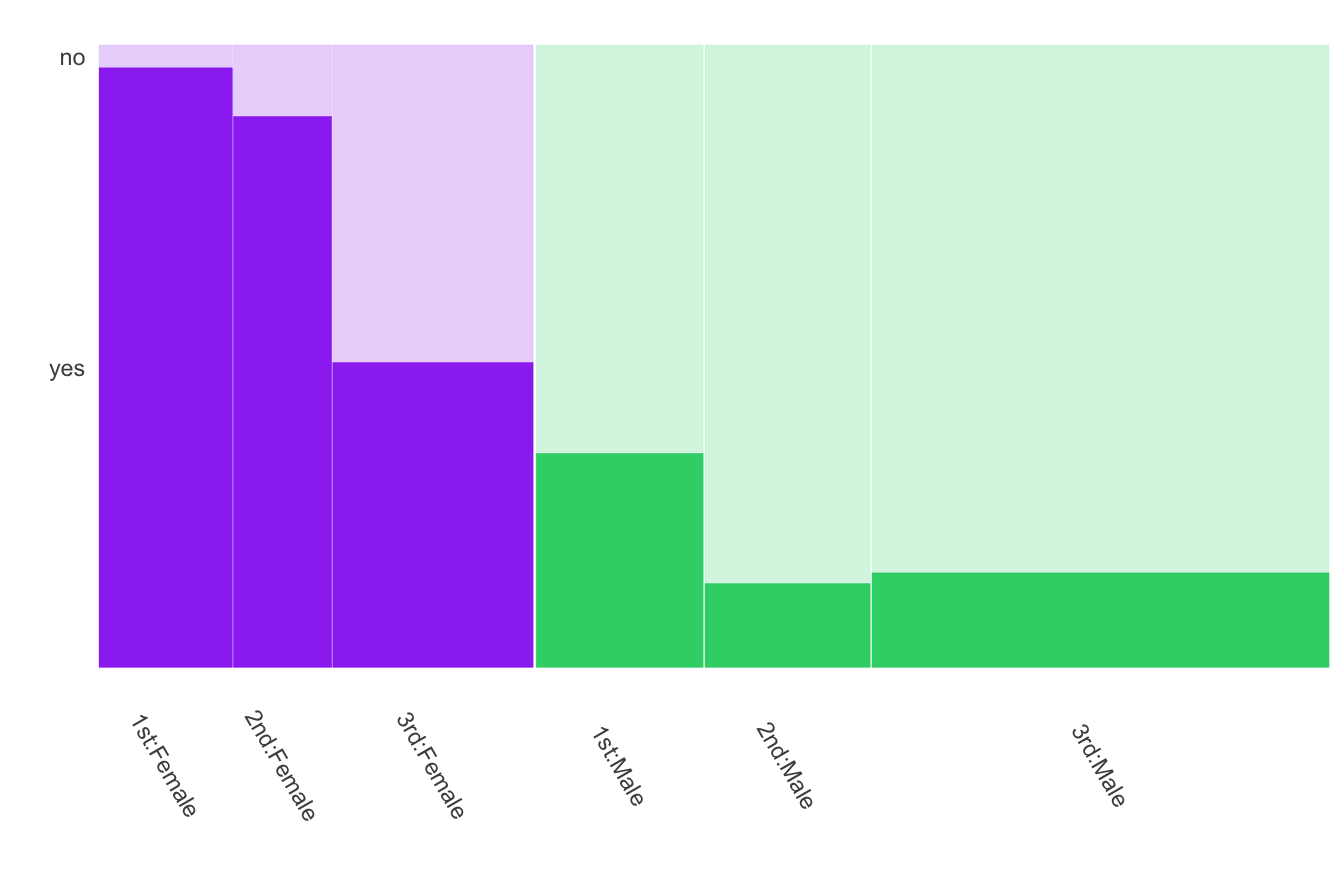
Figure 25.9: Survival rates by sex and class for the passengers
Additional information on the ages of those on board permits study of the possible influence of age. Age distributions by class and crew are shown in Figure 25.10. First Class passengers tended to be older and there were few children amongst them. Most children travelled as Third Class passengers and the Third Class passengers were generally younger. There were a couple of fourteen year-old crew members, but most were aged between 20 and 50. A dotted line has been drawn at 14. This splits the ages into “young” and “old”, close to the numbers in the older, less detailed dataset. Age information is not available for 4 adult passengers, three of whom did not survive.
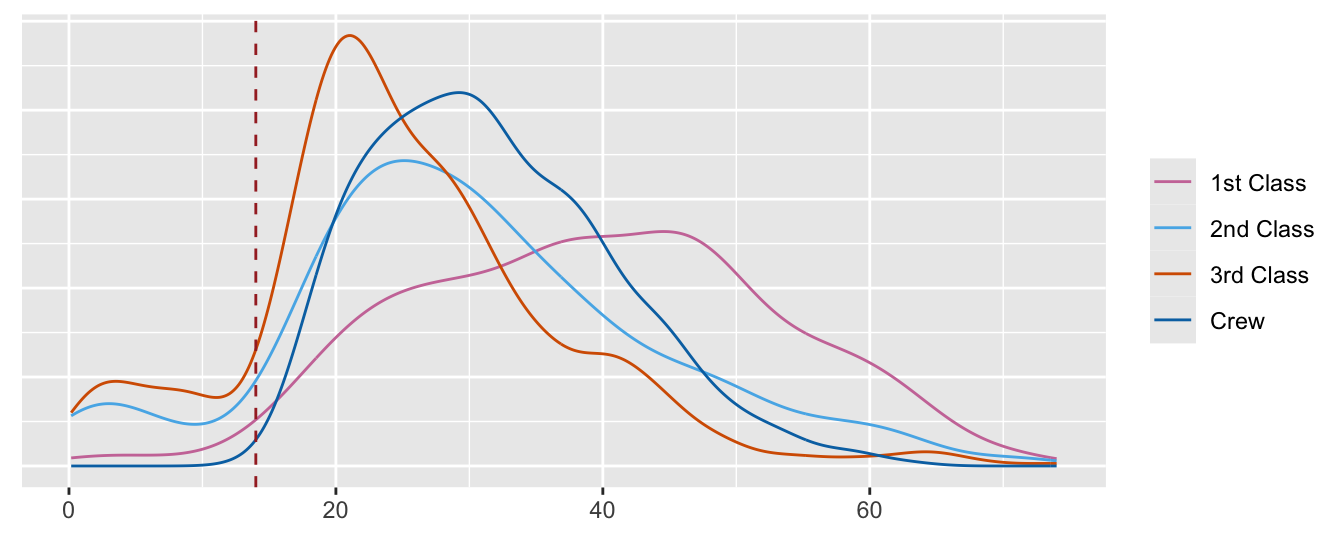
Figure 25.10: Density estimates of age by class on the Titanic
The survival rates by age are shown in Figure 25.11. The area of a point is proportional to the number of that age.
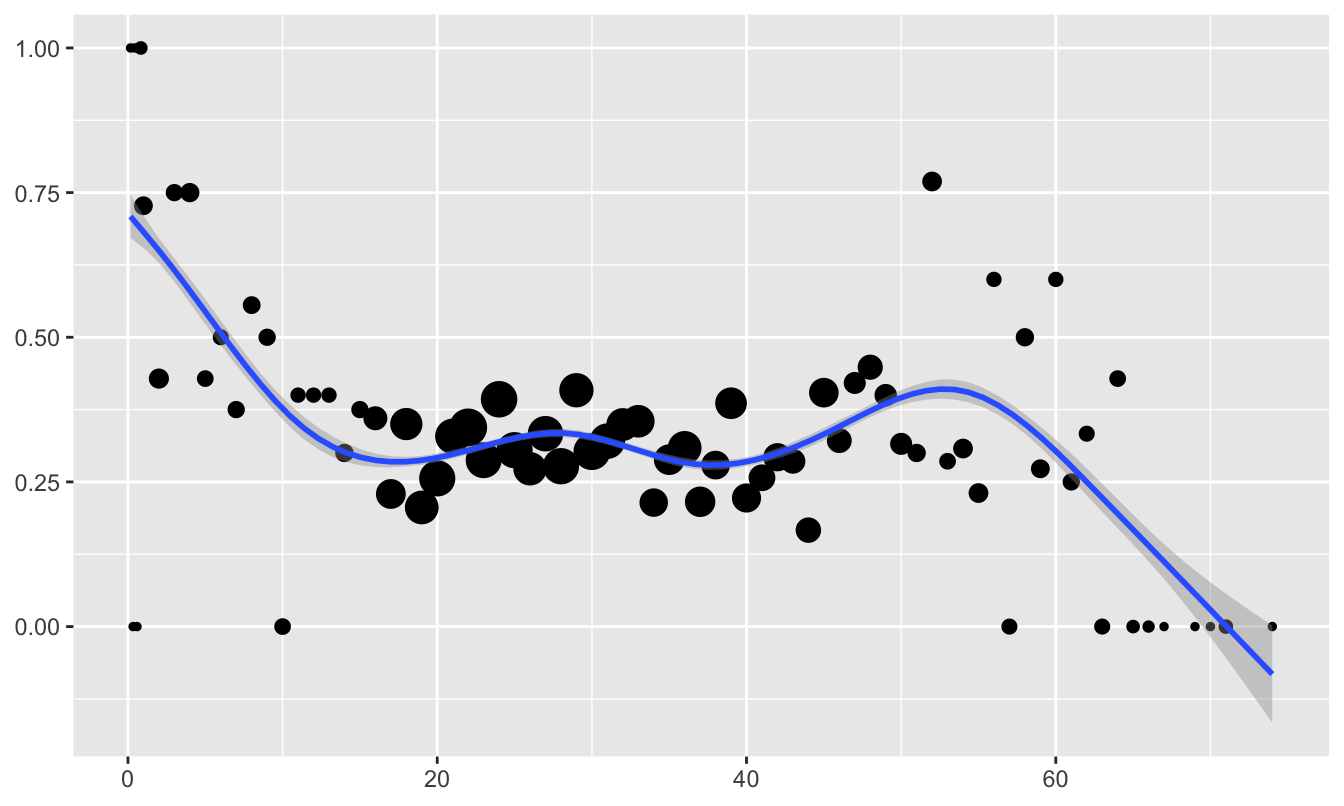
Figure 25.11: Survival rates by age
Survival rates vary little with age, although the few children have higher survival rates and the small number of the very oldest did not survive. Including the effects of sex and class or crew offers an in-depth view, Figure 25.12.
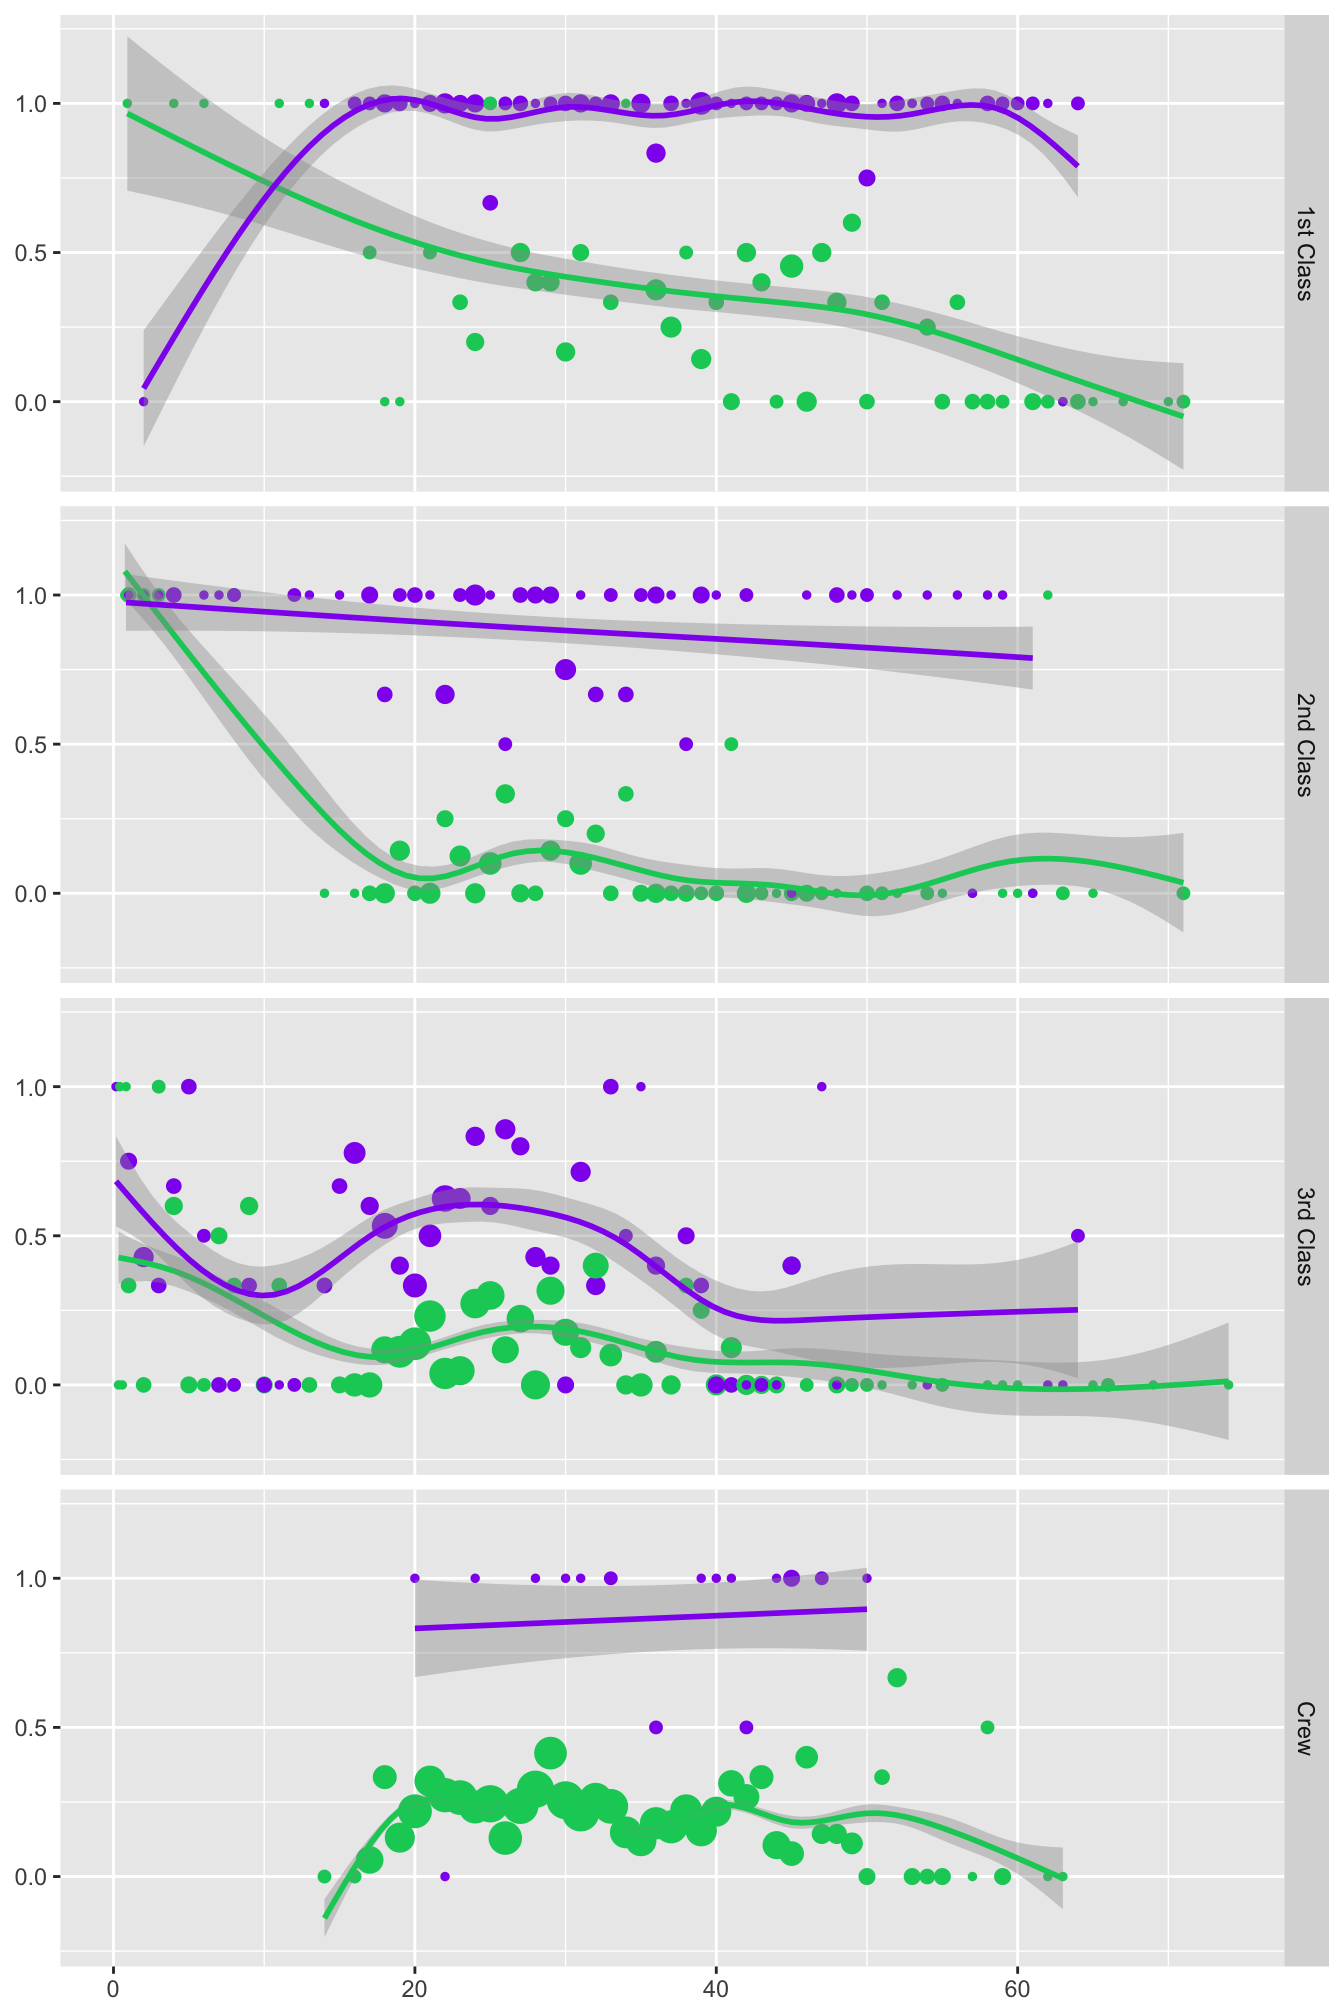
Figure 25.12: Survival rates by age, sex, and class or crew
In all groups the females have higher survival rates across (almost) all ages. The smooths at lower ages are based on very little data. Differences are particularly large in the second class where few men survived. Overall, apart from the survival rates of children, there is little difference in the survival rates by age.
Answers The majority of first class passengers were North Americans, probably returning home after a European trip. There were groups from smaller countries, travelling mainly in third class, who were presumably emigrating. Survival turned out to depend primarily on passenger class and sex, with almost all females travelling 1st class surviving. Amongst the crew, the deck crew who manned the lifeboats had the highest rate of survival by far. The fact that there were nowhere near enough lifeboats was crucial.
Further questions How full were the lifeboats? How many more could have survived if they had been full? Are there related datasets for other maritime disasters that this one might be compared with?
Graphical takeaways
- Drawing barcharts horizontally is essential when there are many categories, and for making sure labels are readable. (Figure 25.6)
- Doubledecker plots are excellent for comparing rates of groups of different sizes. (Figures 25.8 and 25.9)
- Density estimates work well for comparing distributions by group. (Figure 25.10)
- Smooths are valuable for summarising irregular scatterplot patterns. (Figures 25.11 and 25.12)