22.2 Are positive predictive values (PPV) a good criterion?
There are many different possible measures for assessing binary predictions and the paper also uses PPV (Positive Predictive Value). PPV is the number of true positives divided by the total number of positives. Ideally the predictions for each case should be compared directly, but only summary information is available.
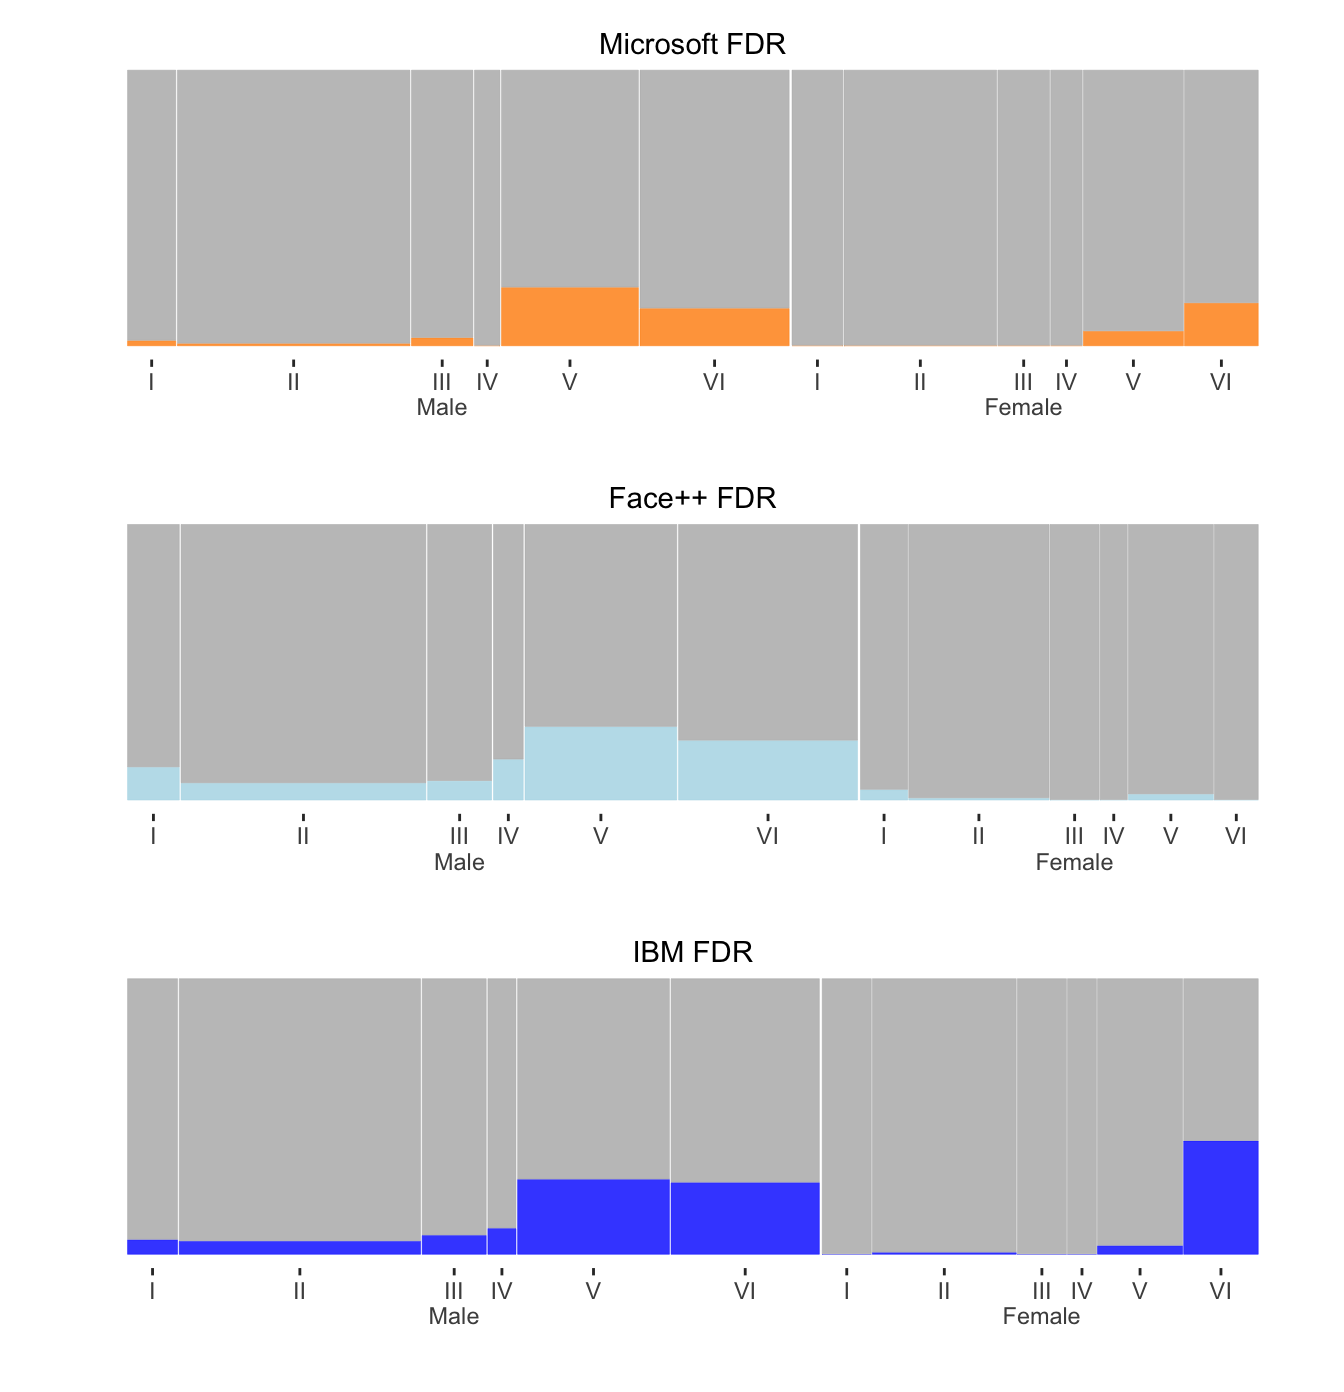
PPV values tend to be high. The graphics can look more informative if (1-PPV) = FDR (False Discovery Rate) is plotted instead. FDRs for each combination of sex and skin shade for each software are shown in Figure 22.4. Whereas the bar widths in Figures 22.3 and 22.2 were the same for each software, being proportional to the number of cases in that group, this is no longer true here. The bar widths are proportional to the number of predictions of that group and that may be different for the different software systems.

Figure 22.4: FDRs by sex and skin colour for three separate software systems. Males are on the left, females on the right, and skin colour gets darker from left to right within sex.
Figure 22.4 displays low rates, as in Figure 22.3, but there are important differences. More men are predicted than there are men in the study, in particular by Face++. The FDR values are mostly higher for males than females. These two conclusions are related. If you predict more males, then you will make fewer mistakes with your predictions of females. The higher FDR rates are for skin shades V and VI, the darkest ones.
There are a number of other criteria that could be plotted and it is astonishing just how many there are, including TPR, TNR, FPR, FNR, SPC, ACC, FOR, DOR, NPV (Wikipedia (2021)). The ones shown seem quite sufficient and the error rates show clearly that the three software systems are not good enough. The analysis also shows where their weaknesses lie, with the highest error rates being for dark-skinned females.
Answers All three software packages had higher error rates for females than for males and error rates rose as skin shade darkened.
Further questions If the individual data were made available, it would be informative to compare predictions across individuals and not just in summary.