10.1 What human spaceflights have there been?
The Tidytuesday project includes a collection of interesting datasets, adding a new one each week (rfordatascience (2020b)). The one uploaded in July 2020 (rfordatascience (2020a)) contained information on manned spaceflights up to the end of 2019. Each flight by each person is a separate record, making 1277 in all. Several flew more than once and there are 565 different people in the dataset. Two Americans, Jerry Ross and Franklin Chiang-Diaz, each flew seven times. There is demographic information on the individuals (sex, year of birth, nationality) and some information on the missions (title, year, spacecraft used, length of mission).
Human spaceflight may be defined as a human reaching outer space by going beyond 100 km from the earth. The Challenger mission of 1986 that ended in disaster did not get that far, but is included in the dataset. The non-fatal Soyuz mission of September 1983 when the launch vehicle caught fire before launching is not included.
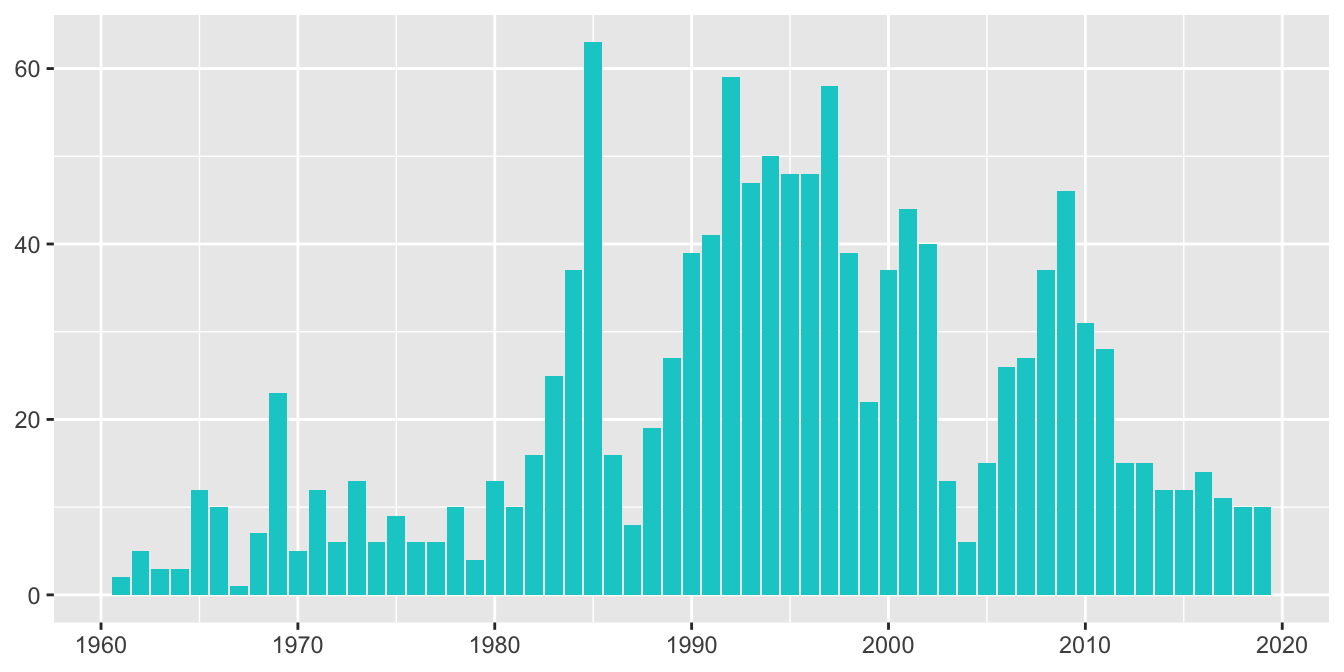
The number of people each year is shown in Figure 10.1. There are sharp drops in numbers after the Soyuz 1 crash in 1967, after the Challenger disaster in 1986 and after the Columbia disaster in 2003. The deaths in Soyuz 11 in 1971 do not seem to have had such an effect, but may have curtailed existing plans of the time.

Figure 10.1: Numbers of people by year of flight
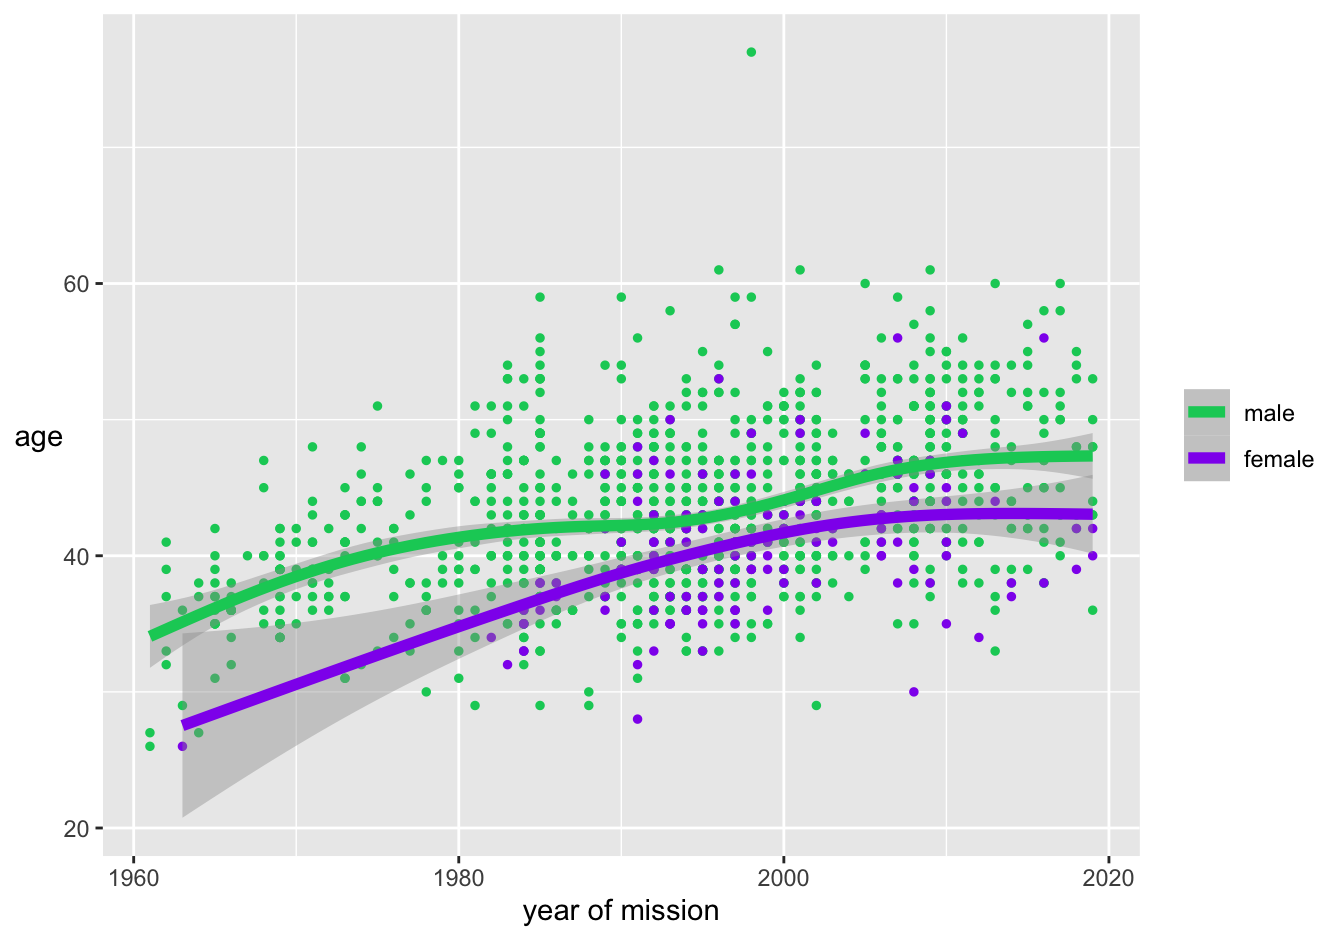
Early on, the participants were male and younger than later on. There have been fewer females and they were on average younger than the males. Figure 10.2 is a scatterplot of age by year of mission with smooths plotted separately for males and females. Age has been calculated as the difference between year of mission and year of birth, so is not exact. The vertical scale is extended beyond most of the data because of the high outlier, John Glenn’s third spaceflight at the age of 77 in 1998. The males have been drawn first and the females on top to emphasise the females.

Figure 10.2: Scatterplot of age by year of flight coloured by sex, with smooths and their confidence intervals
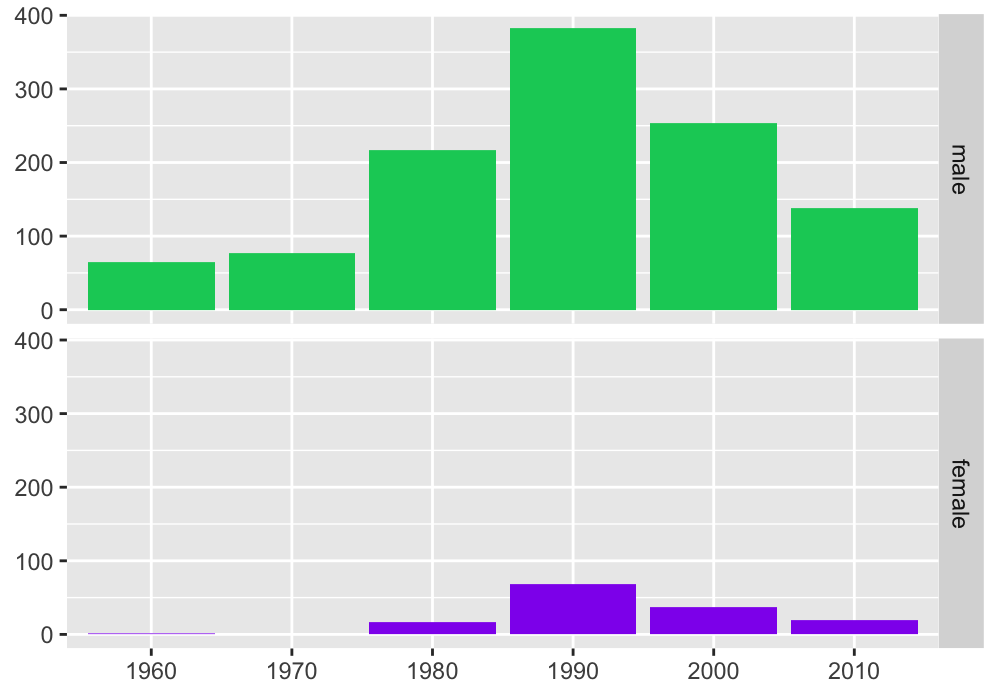
Scatterplots with many points do not convey actual numbers in groups well. In this dataset there are 11 participants aged 41 who went up in space in 1997, 9 men and two women, including three who went up twice. All these 14 points are represented by the same single point in Figure 10.2, coloured female (because of the order of plotting), although they all contribute equally to their respective smoothed fit. Figure 10.3 shows barcharts for males and females across the decades. There have been far fewer females and, in particular, the bar for the only female in the 1960s, Valentina Tereshkova, is barely visible. More went into space in the 1990s than in any other decade.

Figure 10.3: Numbers of participants by decade and by sex